


Transportation Performance Targets
The Hillsborough TPO uses performance measures to inform and guide its policy, planning, and programming activities. Selecting meaningful system performance measures facilitates transparency in the prioritization process, informs funding decisions, and provides a framework for ex post project evaluations.
FAST Act Performance Targets
The Fixing America’s Surface Transportation (FAST) Act is a federal transportation spending authorization bill which encourages MPO/TPOs and State DOTs to invest resources in projects that will make progress toward achieving the national goals of transportation safety, good infrastructure, reduced congestion, system reliability, economic vitality, and sustainability. FAST Act requires MPO/TPOs and State DOTs to establish targets in support of those goals, learn more about those goals.
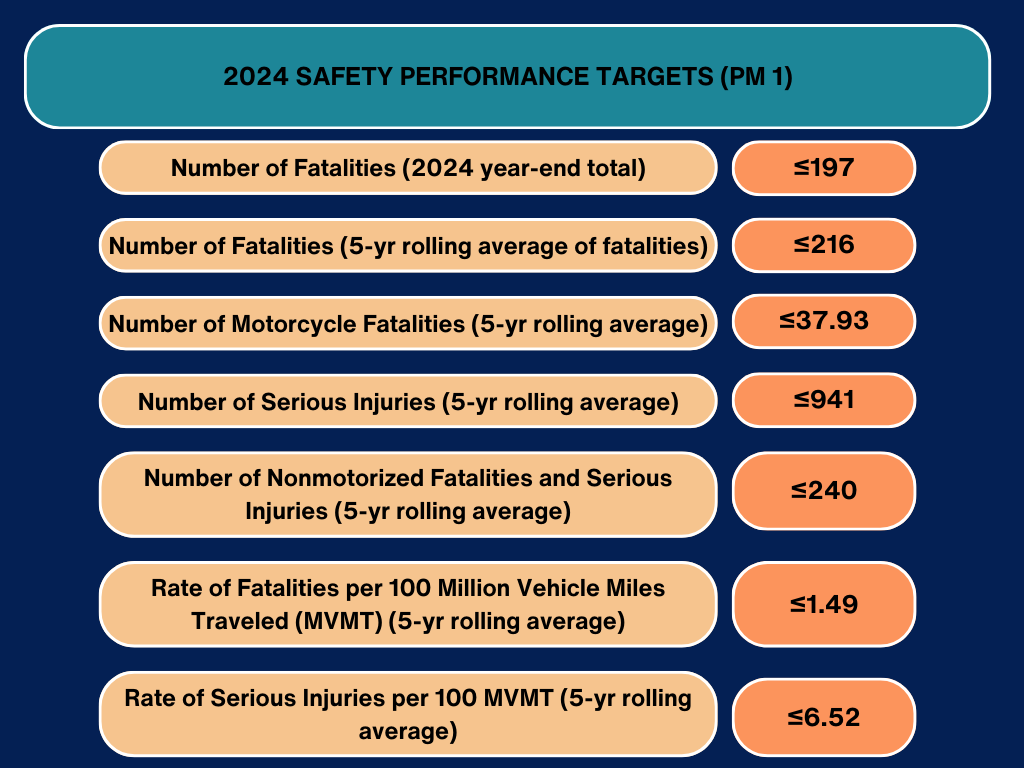
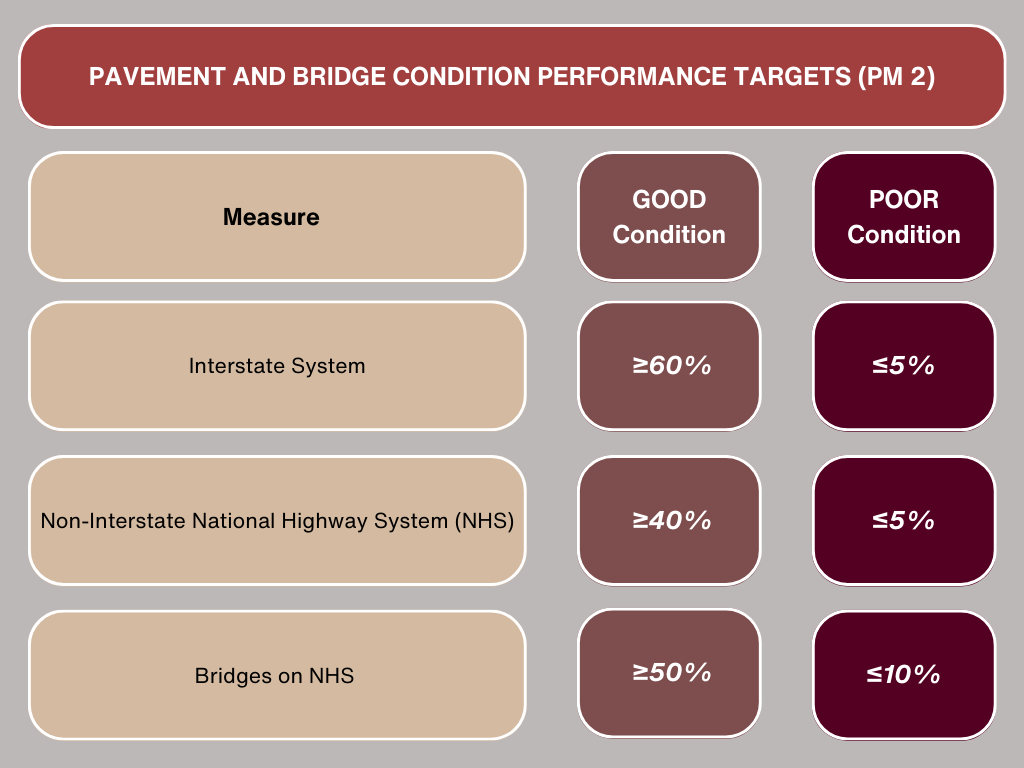
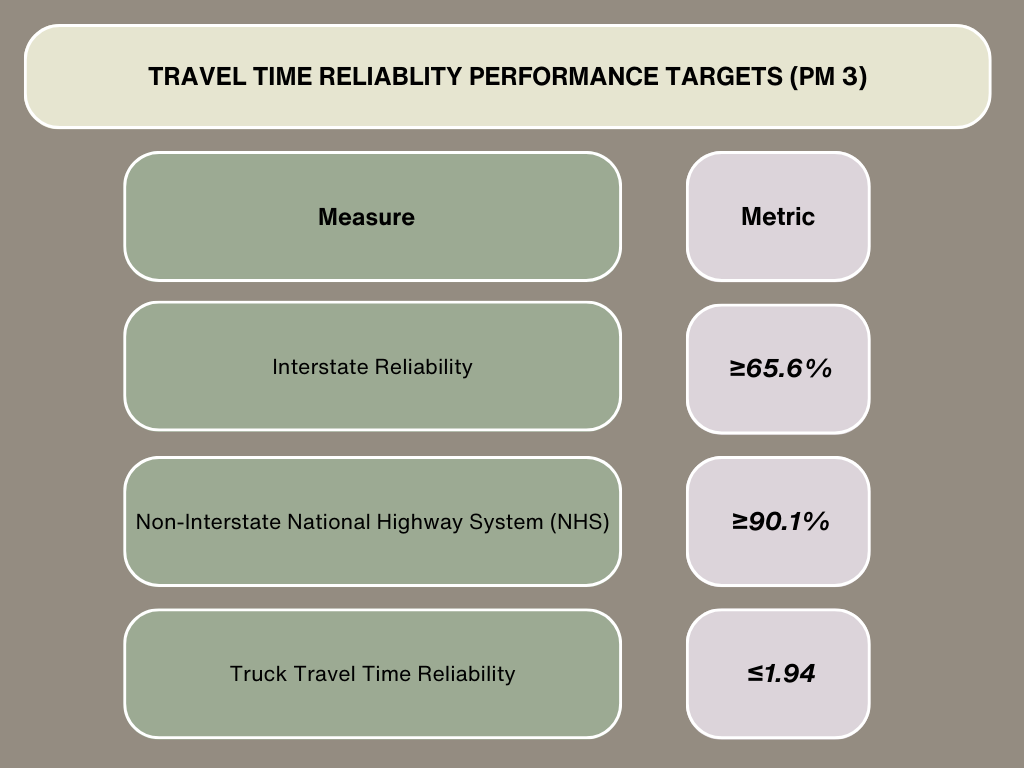
On October 30, 2018, the Hillsborough TPO established performance targets for the Transit Asset Management, Pavement & Bridge Condition, and System Performance Rules to comply with the requirements of the FAST Act. By adopting performance targets, the TPO agrees to plan and program projects in the Transportation Improvement Program to make progress toward achieving the targets. Read more about the baseline targets.
Update: February of every year
Updated: April, 2023
Updated: June 1, 2023
Update: optional with TIP or LRTP update
Update: at TPO disecretion with TIP or LRTP update, but required within 180 days of HART action
Upcoming 2024
State of the System Reports
The TPO recently updated the 2021 State of the System Report which was presented to the Board for adoption in January 2022.
The 2018 State of the System report was adopted by the MPO board in February of 2019. The most recent update to the biannual report card contains new measures relating to transportation equity, air quality, and multimodal accessibility.
The 2016 State of the System Report was the first MPO plan to use FAST Act-inspired performance measures related to safety, pavement and bridge condition, and system performance. Since the report was finalized in December of 2016, it has been distributed to other MPOs around the state to serve as a guide for performance-based planning. An updated report can be found above.
FDOT Mobility Reports
The 2020 FDOTSourceBook is now available. An online, interactive version of the SourceBook is also available.
While the FDOT Mobility Profile Report was released by the Forecasting & Trends Office in 2021, the performance data are current as of 2019. This is a concise reference document providing factoids within the Hillsborough Metropolitan Planning Area. It is useful information for understanding how the performance of state roads compares to all other roads within our county.
Scenario Planning Peer Exchanges
Our Imagine 2040 Plan has been featured at each of the annual FHWA peer exchange workshops on scenario planning. Scenario planning is a framework which tests various future alternatives against state and community needs. For the Imagine 2040 Plan, land use scenarios were first developed to inform the transportation elements of the plan. Learn more about our scenario planning efforts here.