This map shows new resident per acre through 2050 for Hillsborough County. The map shows Tampa's planning districts, UHC's unincorporated planning areas, and the coastal high hazard area (hatched). Darker purple areas denote a higher number of new residents per acre through 2050.

Published
February 2, 2024

Contact
Yassert A. Gonzalez, Manager – Economics, Demographics & Research, 813-582-7356 (o), [email protected], planhillsborough.org

Last updated
February 2, 2024

Every five years, Planning Commission staff conducts a collaborative exercise which results in new long-range forecasts. Land use planners from all jurisdictions were invited to comment on the initial draft. The final draft and all supporting documentation are found here: 2050 Long Range Growth Forecasts.  This is the eighth blog in this series.  To read previous blogs discussing other areas within Hillsborough County, kindly visit our Demographic and Economic Data Page

This month we are reviewing 2050 projections for the Coastal High Hazard Area (CHHA)[ii]. The CHHA comprises coastal lands that have a significantly higher probability of flood and wind damage during storm events due to their proximity to large bodies of water.  It is updated periodically and defined by statute. Moreover, local comprehensive plans contain policy language to help mitigate the overall hazard due to the potential of coastal flooding. As seen in Figure 1, parcels within the CHHA are concentrated along Tampa Bay, the Hillsborough River, the Alafia River, and other large water bodies.

In terms of densities and intensities within CHHA, we used the adopted Future Land Use categories.  These densities and intensities are not new and were adopted well before these projections were developed. Below, we will be reviewing projections for those areas in Hillsborough County wholly or partially within the CHHA. As seen in Figure 1, 4 of 5 Tampa Planning Districts are partially within the CHHA. Moreover, only nine unincorporated planning areas have population and/or jobs inside the CHHA.

Figure 1.  Tampa’s Planning Districts and Unincorporated Hillsborough Couty’s Planning Areas in relation to the Coastal High Hazard Area

This map shows the Coastal High Hazard Area (CHHA) superimposed over Tampa's planning districts and Unincorporated Hillsborough County's planning areas. Four of the 5 Tampa's planning districts are partially within the CHHA. Moreover, 9 of 25 unincorporated planning areas are partially within the CHHA.
This map shows the Coastal High Hazard Area (CHHA) superimposed over Tampa’s planning districts and Unincorporated Hillsborough County’s planning areas. Four of the 5 Tampa’s planning districts are partially within the CHHA. Moreover, 9 of 25 unincorporated planning areas are partially within the CHHA.

Population Growth in the CHHA

From 2010 to 2020, the population inside the CHHA grew to 155,212 people (23,223 new residents and 18% higher than 2010).  Currently, only 10% of the county’s population lives inside the CHHA. Simultaneously, from 2010 to 2020, the population outside the CHHA grew to 1,323,547 people (226,310 new residents or 21% higher than 2010). By 2050, we expect the population inside the CHHA to reach 216,010 people (60,798 new residents or 39% higher than the 2020 population).  By 2050, the share of the county’s population inside the CHHA is expected to increase slightly to 11%. Meanwhile, 2020-2050 percent population growth outside the CHHA would be slightly lower.  By 2050, the population outside the CHHA is expected to reach 1,801,284 people (477,737 new residents or 36% higher than the 2020 population). See Table 1 and Figures 2a-2g.

Table 1.  Population Estimates and Projections Inside and Outside the CHHA

Coastal High Hazard Area20102015202020502010-2020 New Residents2010-2020 Percent Change2020-2050 New Residents2020-2050 Percent Change
Inside CHHA131,989140,103155,212216,01023,22318%60,79839%
Outside CHHA1,097,2371,185,4601,323,5471,801,284226,31021%477,73736%
Countywide Total1,229,2261,325,5631,478,7592,017,294249,53320%538,53536%

Figure 2a. Hillsborough County – Population inside and outside Coastal High Hazard Area

This chart shows Hillsborough County's population inside and outside the CHHA. Currently, 155,212 people reside inside the CHHA and 1.3 million people reside outside CHHA. By 2050, 216,010 are expected to reside inside the CHHA and 1.8 million people are expected to reside outside the CHHA.
This chart shows Hillsborough County’s population inside and outside the CHHA. Currently, 155,212 people reside inside the CHHA and 1.3 million people reside outside CHHA. By 2050, 216,010 are expected to reside inside the CHHA and 1.8 million people are expected to reside outside the CHHA.

Figure 2b. Hillsborough County – Share of Population inside and outside Coastal High Hazard Area

This chart shows Hillsborough County's share of the population inside and outside the CHHA. Currently, 11% of the population reside inside the CHHA and 89% of the population reside outside CHHA. By 2050, the share are expected to remain constant. Namely, 11% of the population reside inside the CHHA and 89% of the population reside outside CHHA.
This chart shows Hillsborough County’s share of the population inside and outside the CHHA. Currently, 11% of the population reside inside the CHHA and 89% of the population reside outside CHHA. By 2050, the share are expected to remain constant. Namely, 11% of the population reside inside the CHHA and 89% of the population reside outside CHHA.

Figure 2c. Hillsborough County – New Residents inside and outside Coastal High Hazard Area

This chart shows Hillsborough County's new residents inside and outside the CHHA. From 2015 to 2020, 15,110 new residents moved inside the CHHA and 138,086 new residents moved outside CHHA. From 2020 to 2050, 60,798 new residents are expected to move inside the CHHA and 477,737 new residents are expected to move outside the CHHA.
This chart shows Hillsborough County’s new residents inside and outside the CHHA. From 2015 to 2020, 15,110 new residents moved inside the CHHA and 138,086 new residents moved outside CHHA. From 2020 to 2050, 60,798 new residents are expected to move inside the CHHA and 477,737 new residents are expected to move outside the CHHA.

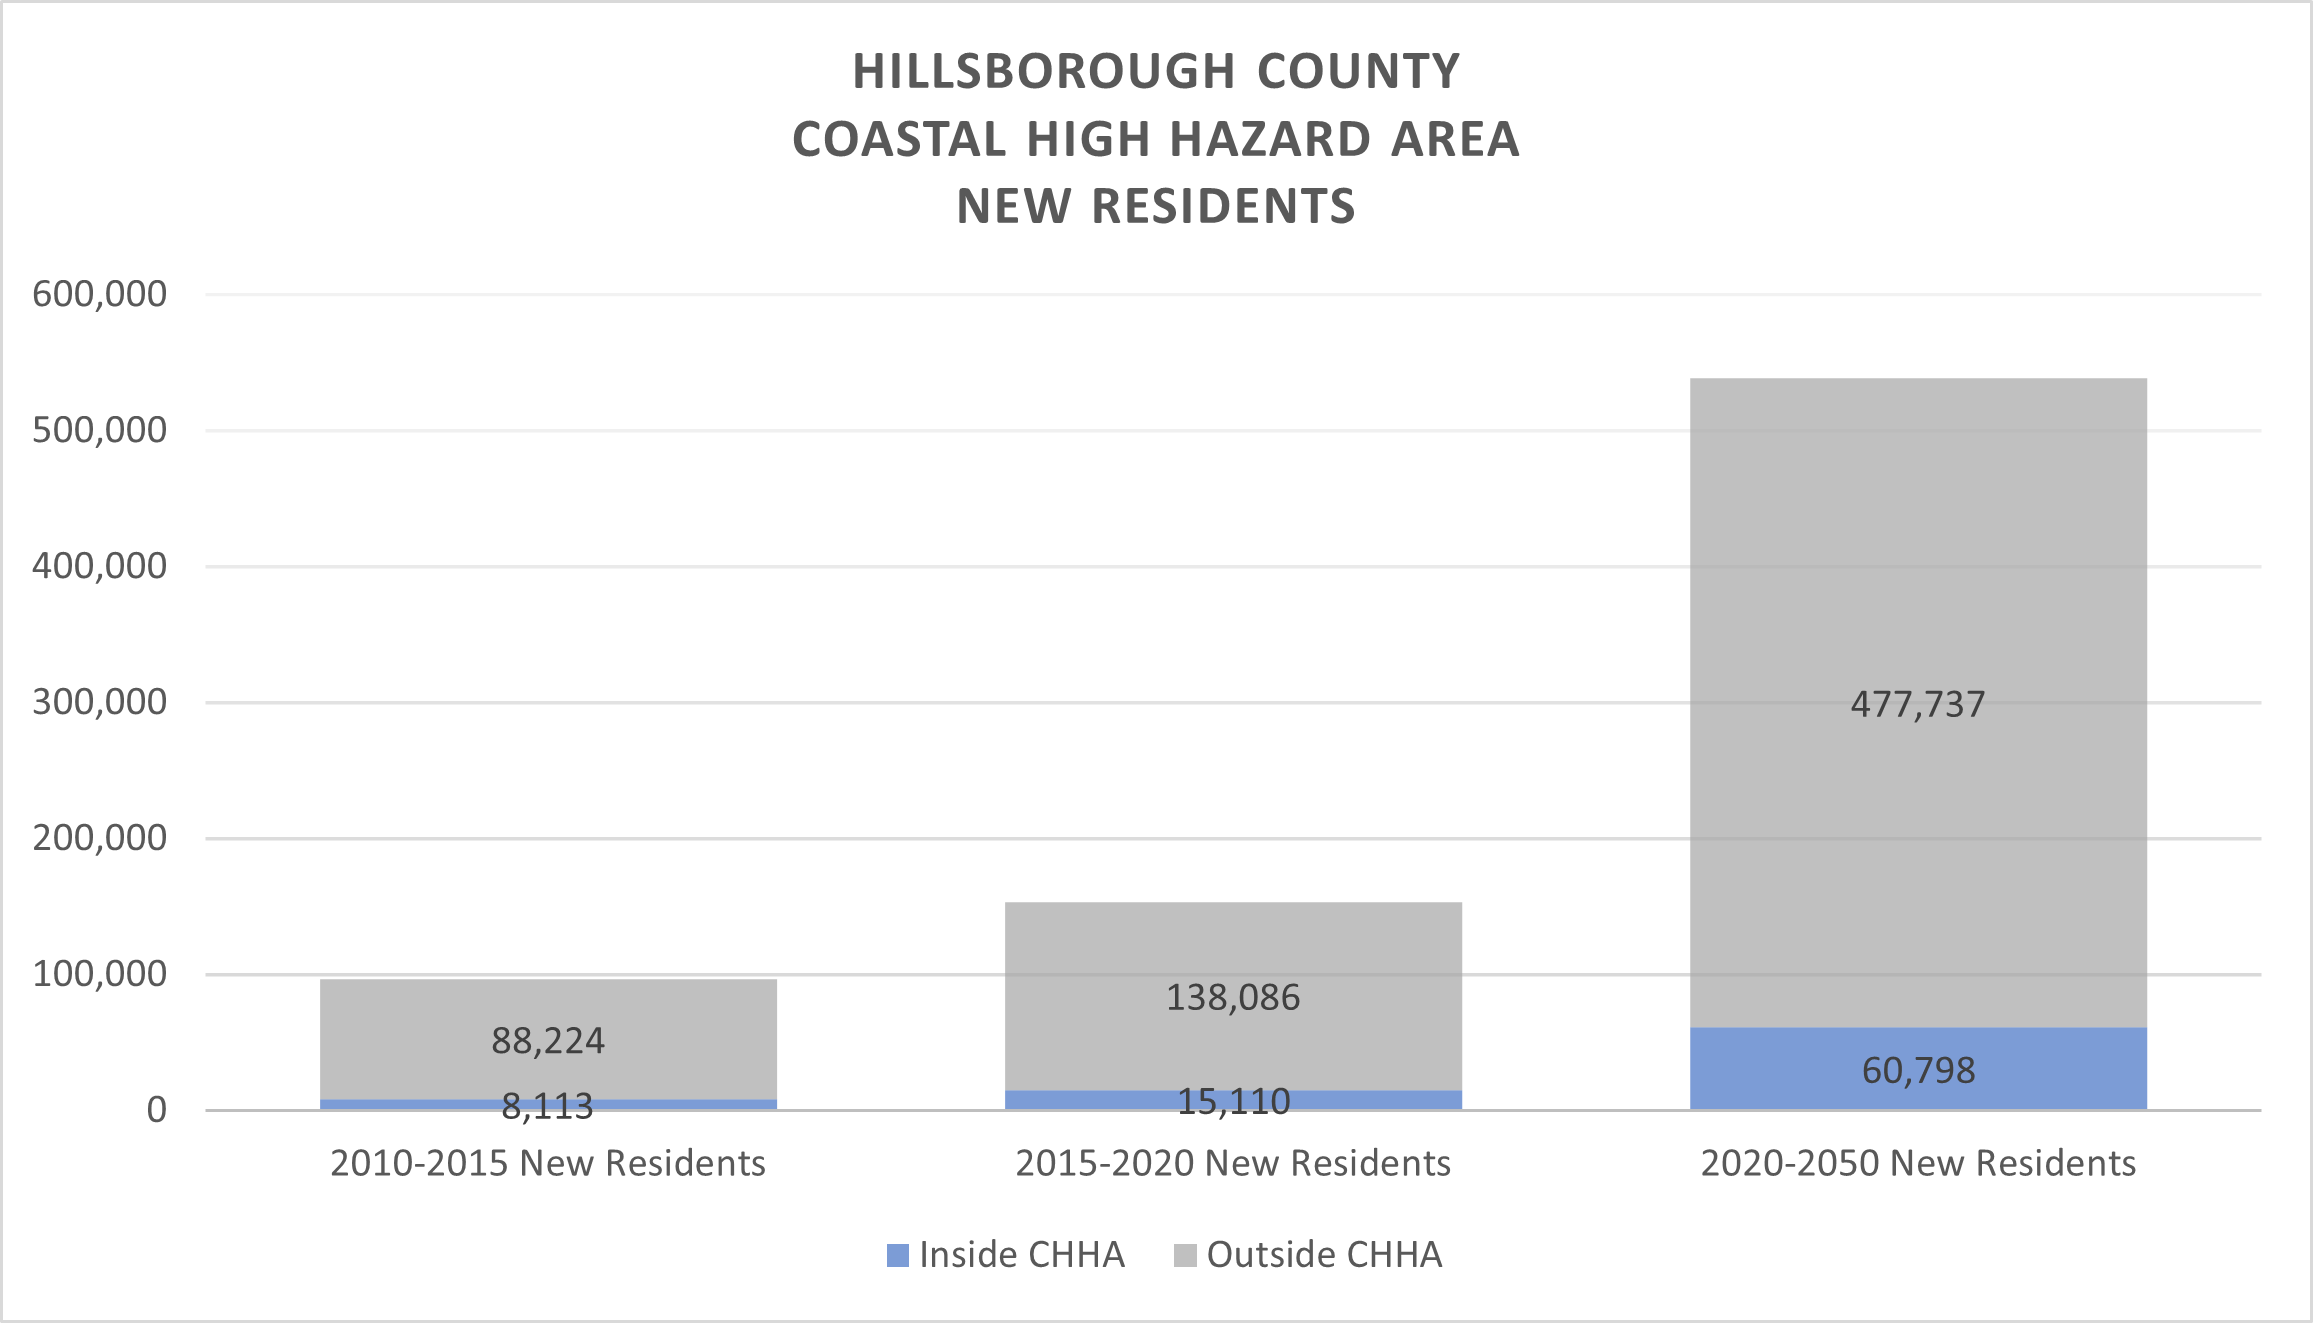
Figure 2d. Hillsborough County – Share of New Residents inside and outside Coastal High Hazard Area

This chart shows Hillsborough County's share of new resident inside and outside the CHHA. From 2015 to 2020, 10% of the new residents moved inside the CHHA and 90% of the new residents moved outside CHHA. From 2020 to 2050, the share of new residents inside CHHA is expected to decrease slightly. Namely, 11% of the new residents are expected to move inside the CHHA and 89% of the county's new residents are expected to move outside CHHA.
This chart shows Hillsborough County’s share of new resident inside and outside the CHHA. From 2015 to 2020, 10% of the new residents moved inside the CHHA and 90% of the new residents moved outside CHHA. From 2020 to 2050, the share of new residents inside CHHA is expected to decrease slightly. Namely, 11% of the new residents are expected to move inside the CHHA and 89% of the county’s new residents are expected to move outside CHHA.

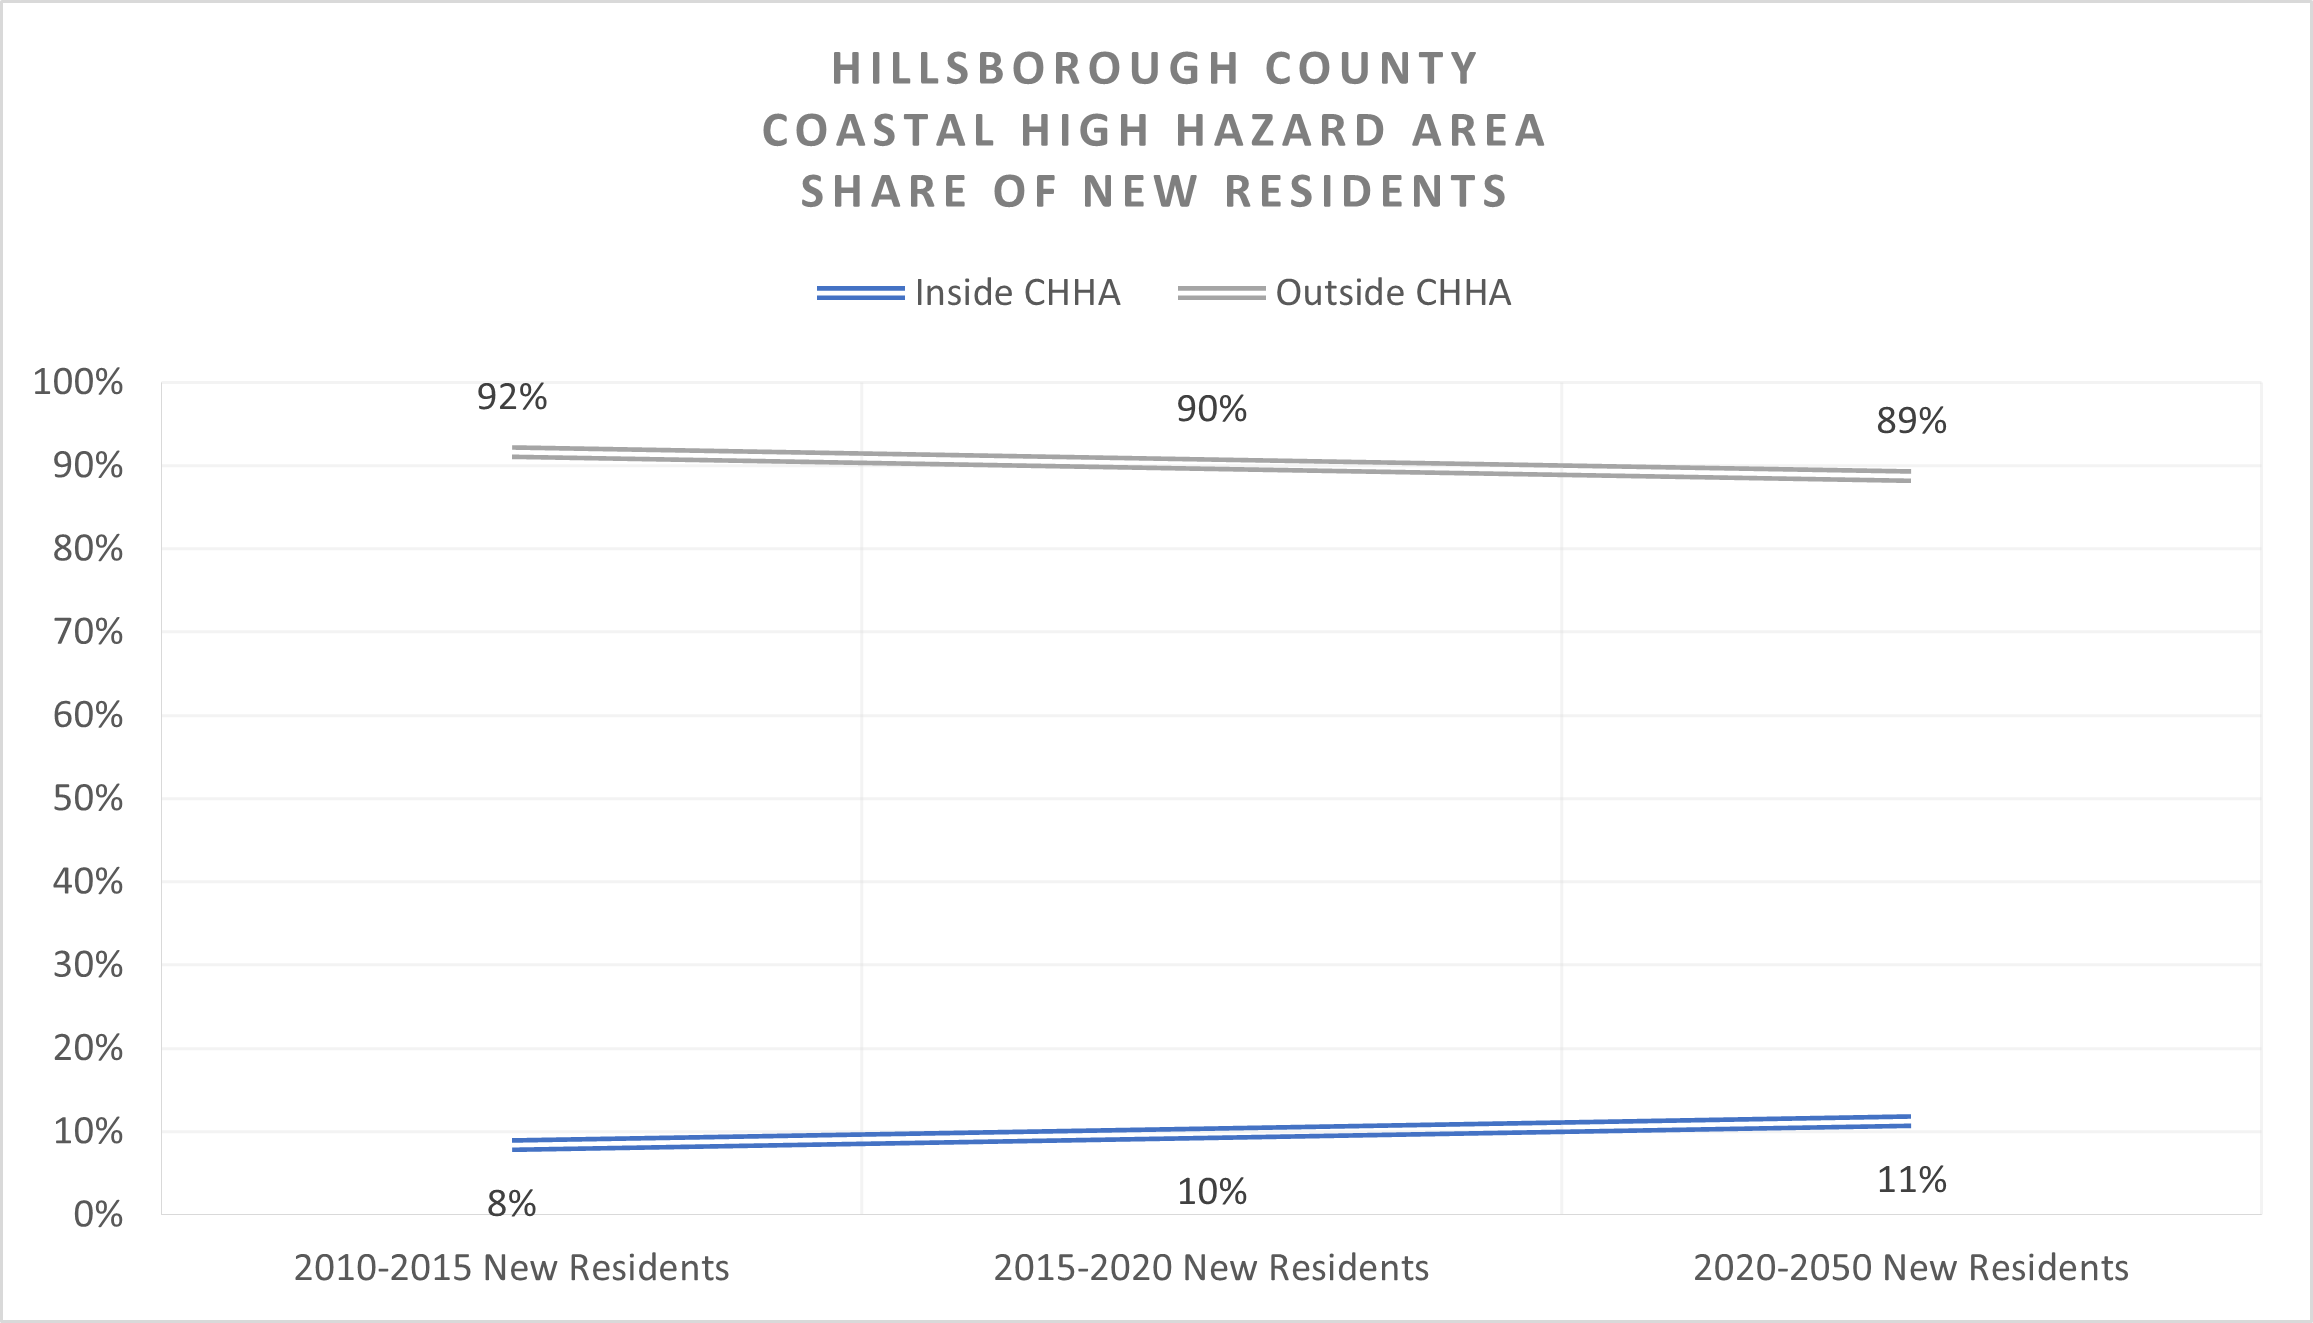
Figure 2e. Hillsborough County – New Residents Since 2010 inside and outside Coastal High Hazard Area

This chart shows Hillsborough County's new residents inside and outside the CHHA. From 2010 to 2020, 23,223 new residents moved inside the CHHA and 226,310 new residents moved outside CHHA. From 2010 to 2050, 84,021 new residents are expected to move inside the CHHA and 704,047 new residents are expected to move outside the CHHA.
This chart shows Hillsborough County’s new residents inside and outside the CHHA. From 2010 to 2020, 23,223 new residents moved inside the CHHA and 226,310 new residents moved outside CHHA. From 2010 to 2050, 84,021 new residents are expected to move inside the CHHA and 704,047 new residents are expected to move outside the CHHA.

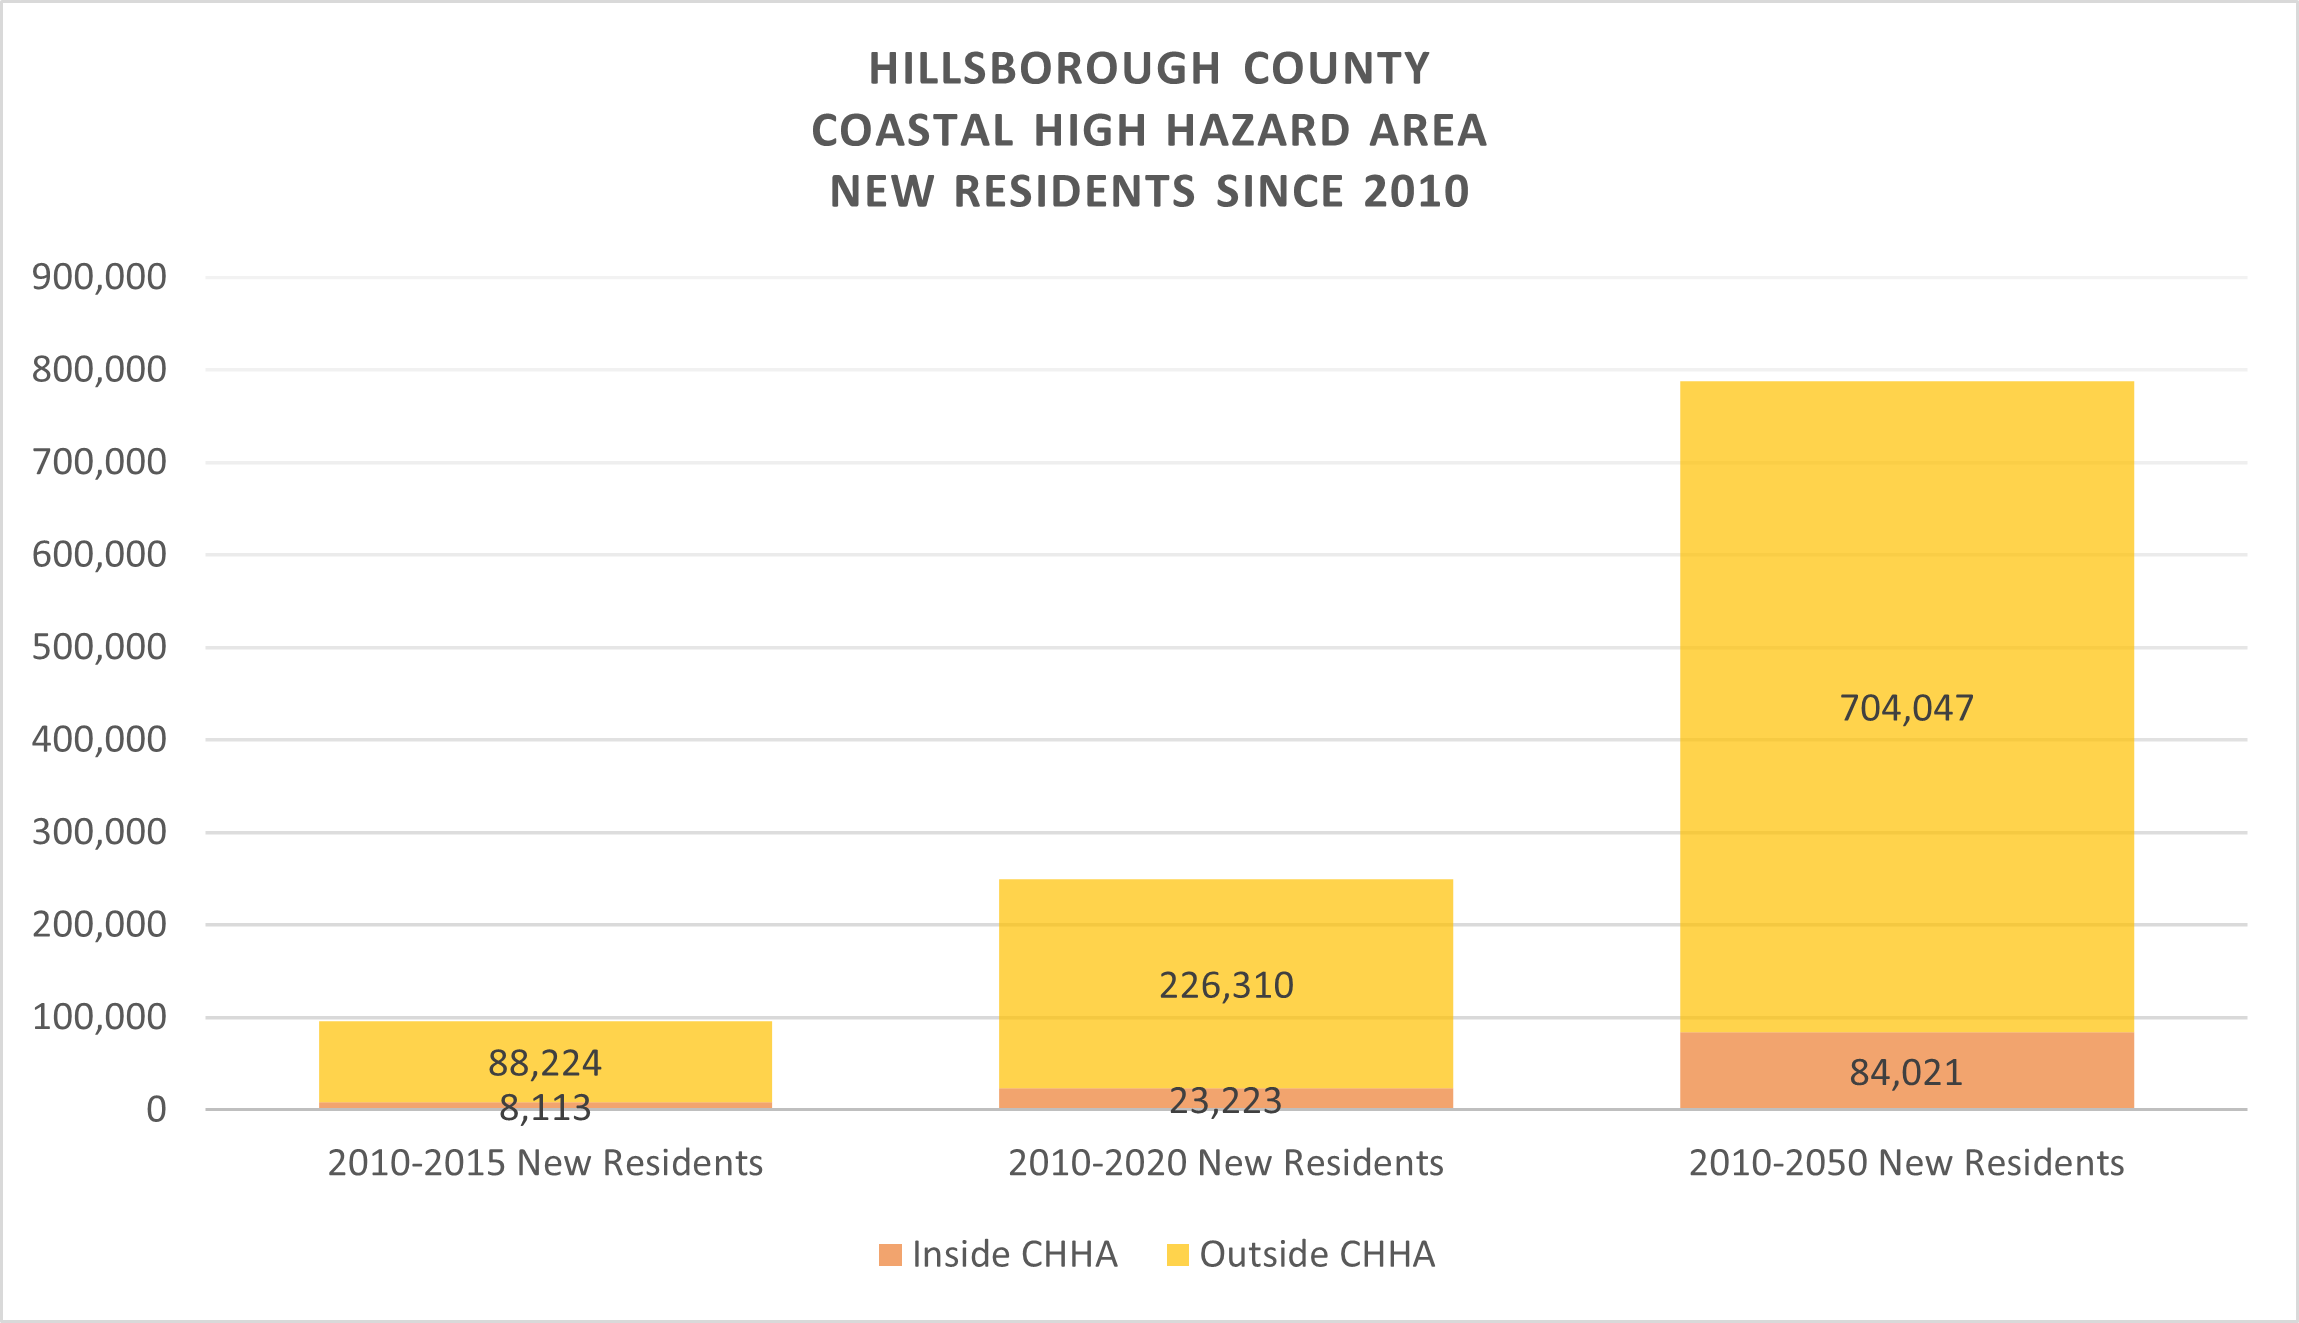
Figure 2f. Hillsborough County – Share of New Residents Since 2010 inside and outside Coastal High Hazard Area

This chart shows Hillsborough County's share of population inside and outside the CHHA. From 2010 to 2020, 9% of the new residents moved inside the CHHA and 91% of new residents moved outside CHHA. From 2010 to 2050, the share are expected to increase slightly. Namely, 11% of the new residents are expected to move inside the CHHA and 89% of the new residents are expected to move outside CHHA.
This chart shows Hillsborough County’s share of population inside and outside the CHHA. From 2010 to 2020, 9% of the new residents moved inside the CHHA and 91% of new residents moved outside CHHA. From 2010 to 2050, the share are expected to increase slightly. Namely, 11% of the new residents are expected to move inside the CHHA and 89% of the new residents are expected to move outside CHHA.

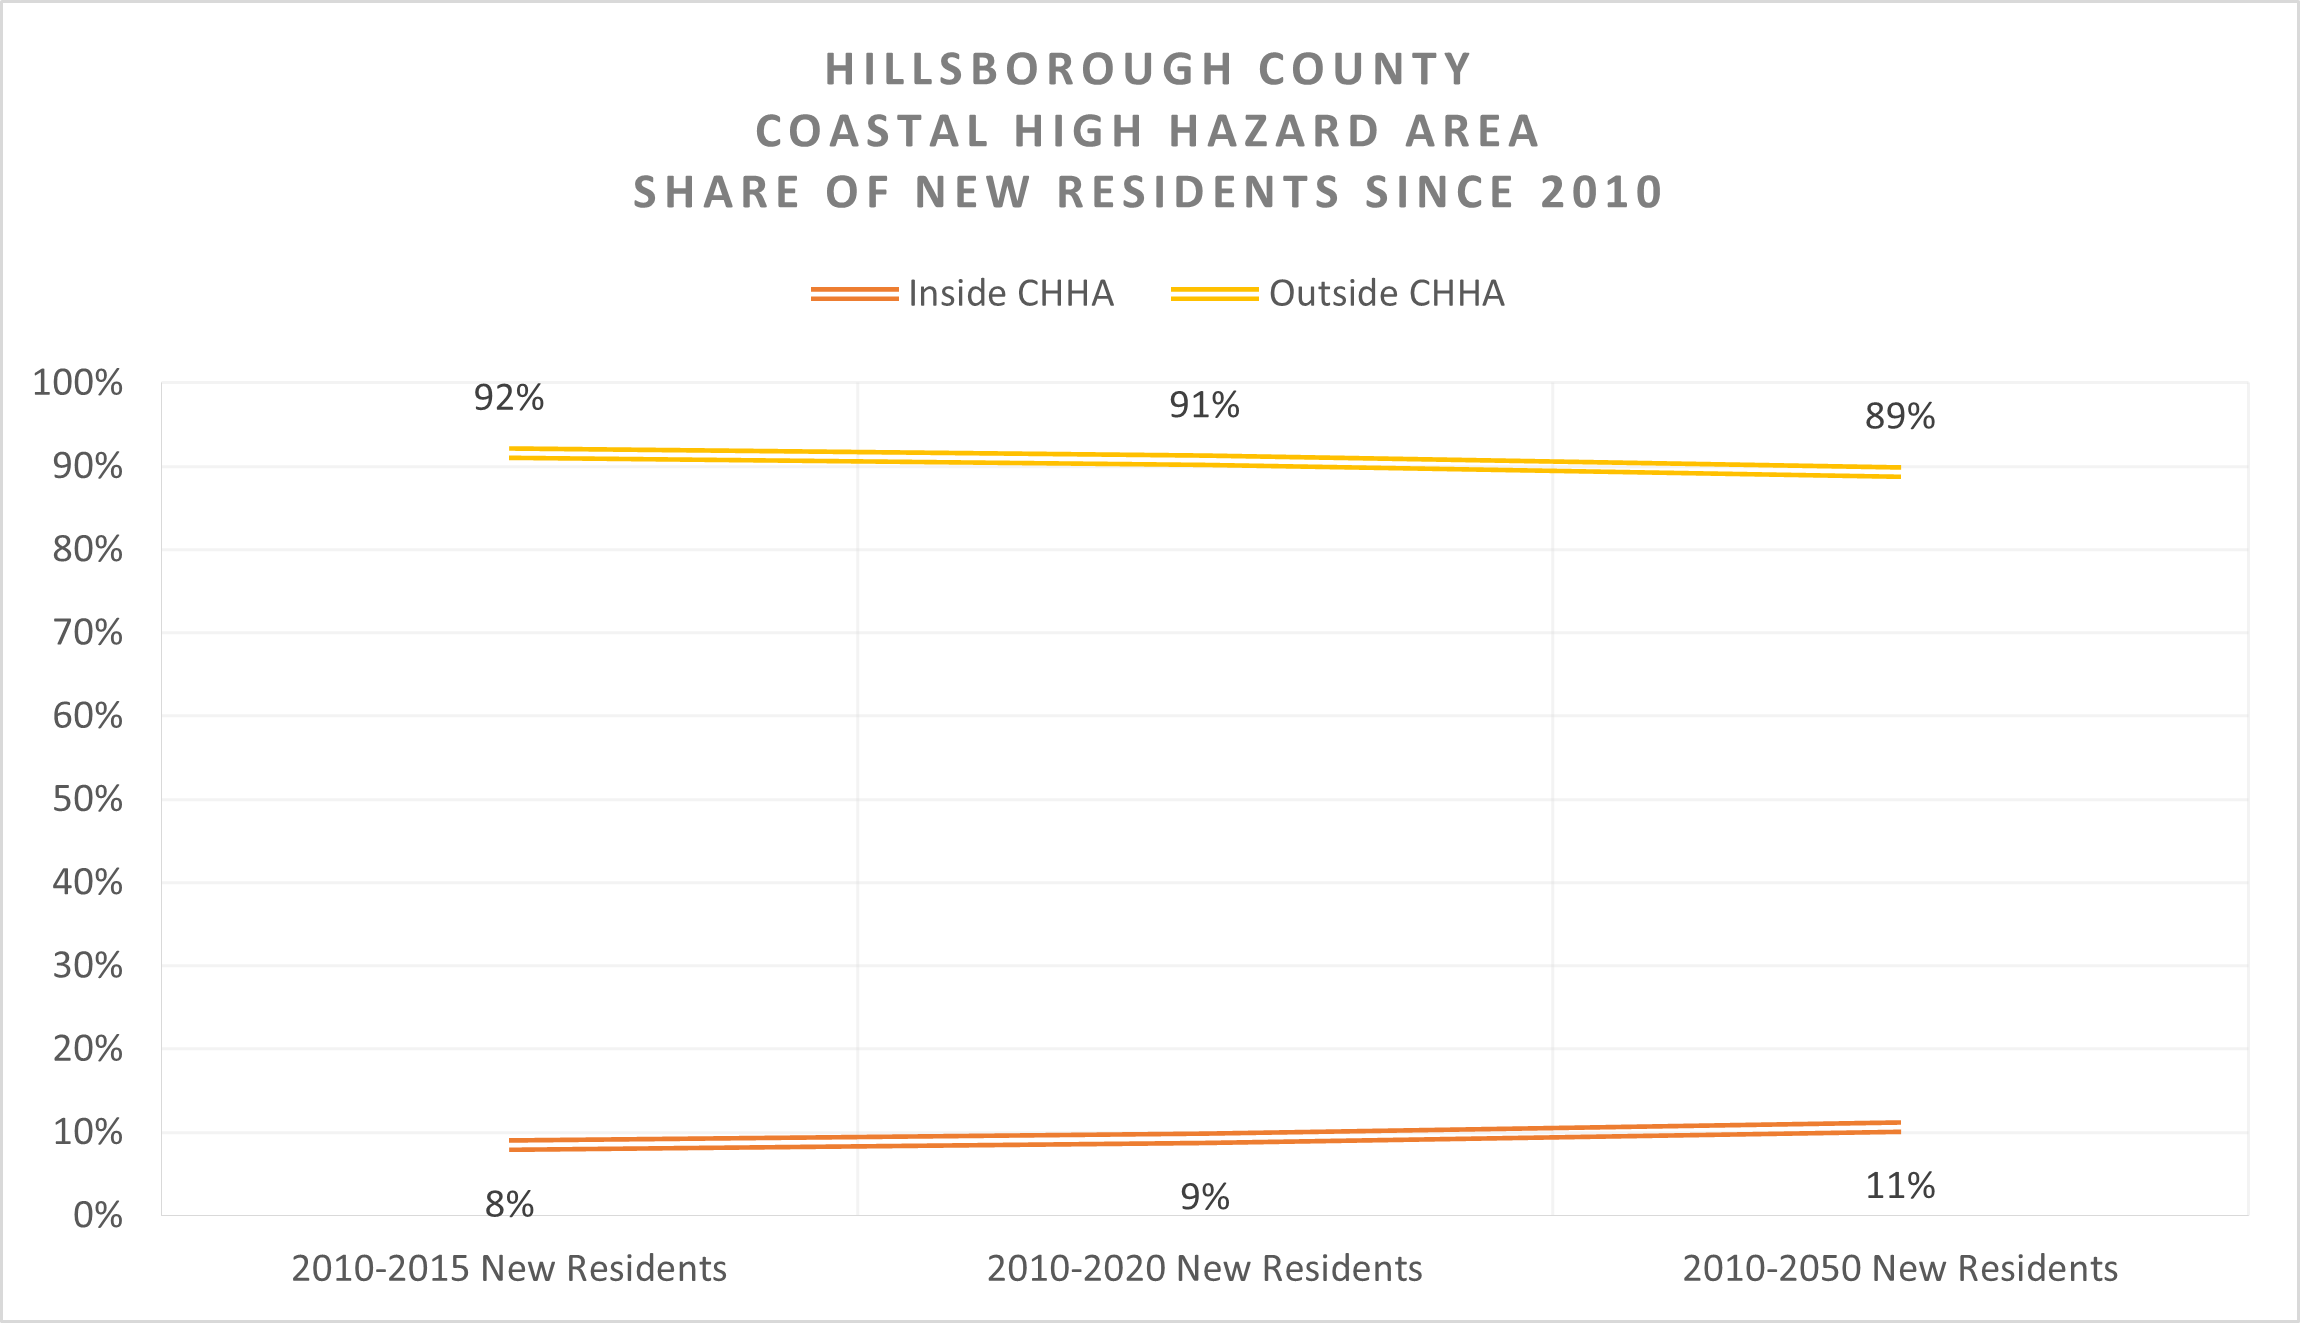
Figure 2g. Hillsborough County – New Population per Acre Through 2050

This map shows new resident per acre through 2050 for Hillsborough County. The map shows Tampa's planning districts, UHC's unincorporated planning areas, and the coastal high hazard area (hatched). Darker purple areas denote a higher number of new residents per acre through 2050.
This map shows new resident per acre through 2050 for Hillsborough County. The map shows Tampa’s planning districts, UHC’s unincorporated planning areas, and the coastal high hazard area (hatched). Darker purple areas denote a higher number of new residents per acre through 2050.

EMPLOYMENT GROWTH IN THE CHHA

From 2010 to 2020, employment inside the CHHA grew to 173,947 jobs (54,467 new jobs and 46% higher than 2010).  Currently, only 18% of the county’s employment is located inside the CHHA. Simultaneously, from 2010 to 2020, employment outside the CHHA grew to 785,440 jobs (187,716 new jobs or 31% higher than 2010). By 2050, we expect employment inside the CHHA to reach 234,551 jobs (60,605 new jobs or 35% higher than the 2020 employment).  By 2050, the share of the county’s employment inside the CHHA is expected to decrease slightly to 17%. Meanwhile, employment 2020-2050 percent growth outside the CHHA would be higher.  By 2050, employment outside the CHHA is expected to reach 1,157,749 jobs (372,309 new jobs or 47% higher than the 2020 employment). See Table 2 and Figures 3a-3g.

Table 2.  Employment Estimates and Projections Inside and Outside the CHHA

Coastal High Hazard Area20102015202020502010-2020 New Employment2010-2020 Percent Change2020-2050 New Employment2020-2050 Percent Change
Inside CHHA119,480142,319173,947234,55154,46746%60,60535%
Outside CHHA597,724697,581785,4401,157,749187,71631%372,30947%
Countywide Total717,204839,900959,3871,392,301242,18334%432,91445%

Figure 3a. Hillsborough County – Employment inside and outside Coastal High Hazard Area

This chart shows Hillsborough County's employment inside and outside the CHHA. Currently, 173,947 jobs are located inside the CHHA and 785,440 jobs are located outside CHHA. By 2050, 234,551 will be inside the CHHA and 1.2 million jobs will be outside the CHHA.
This chart shows Hillsborough County’s employment inside and outside the CHHA. Currently, 173,947 jobs are located inside the CHHA and 785,440 jobs are located outside CHHA. By 2050, 234,551 will be inside the CHHA and 1.2 million jobs will be outside the CHHA.

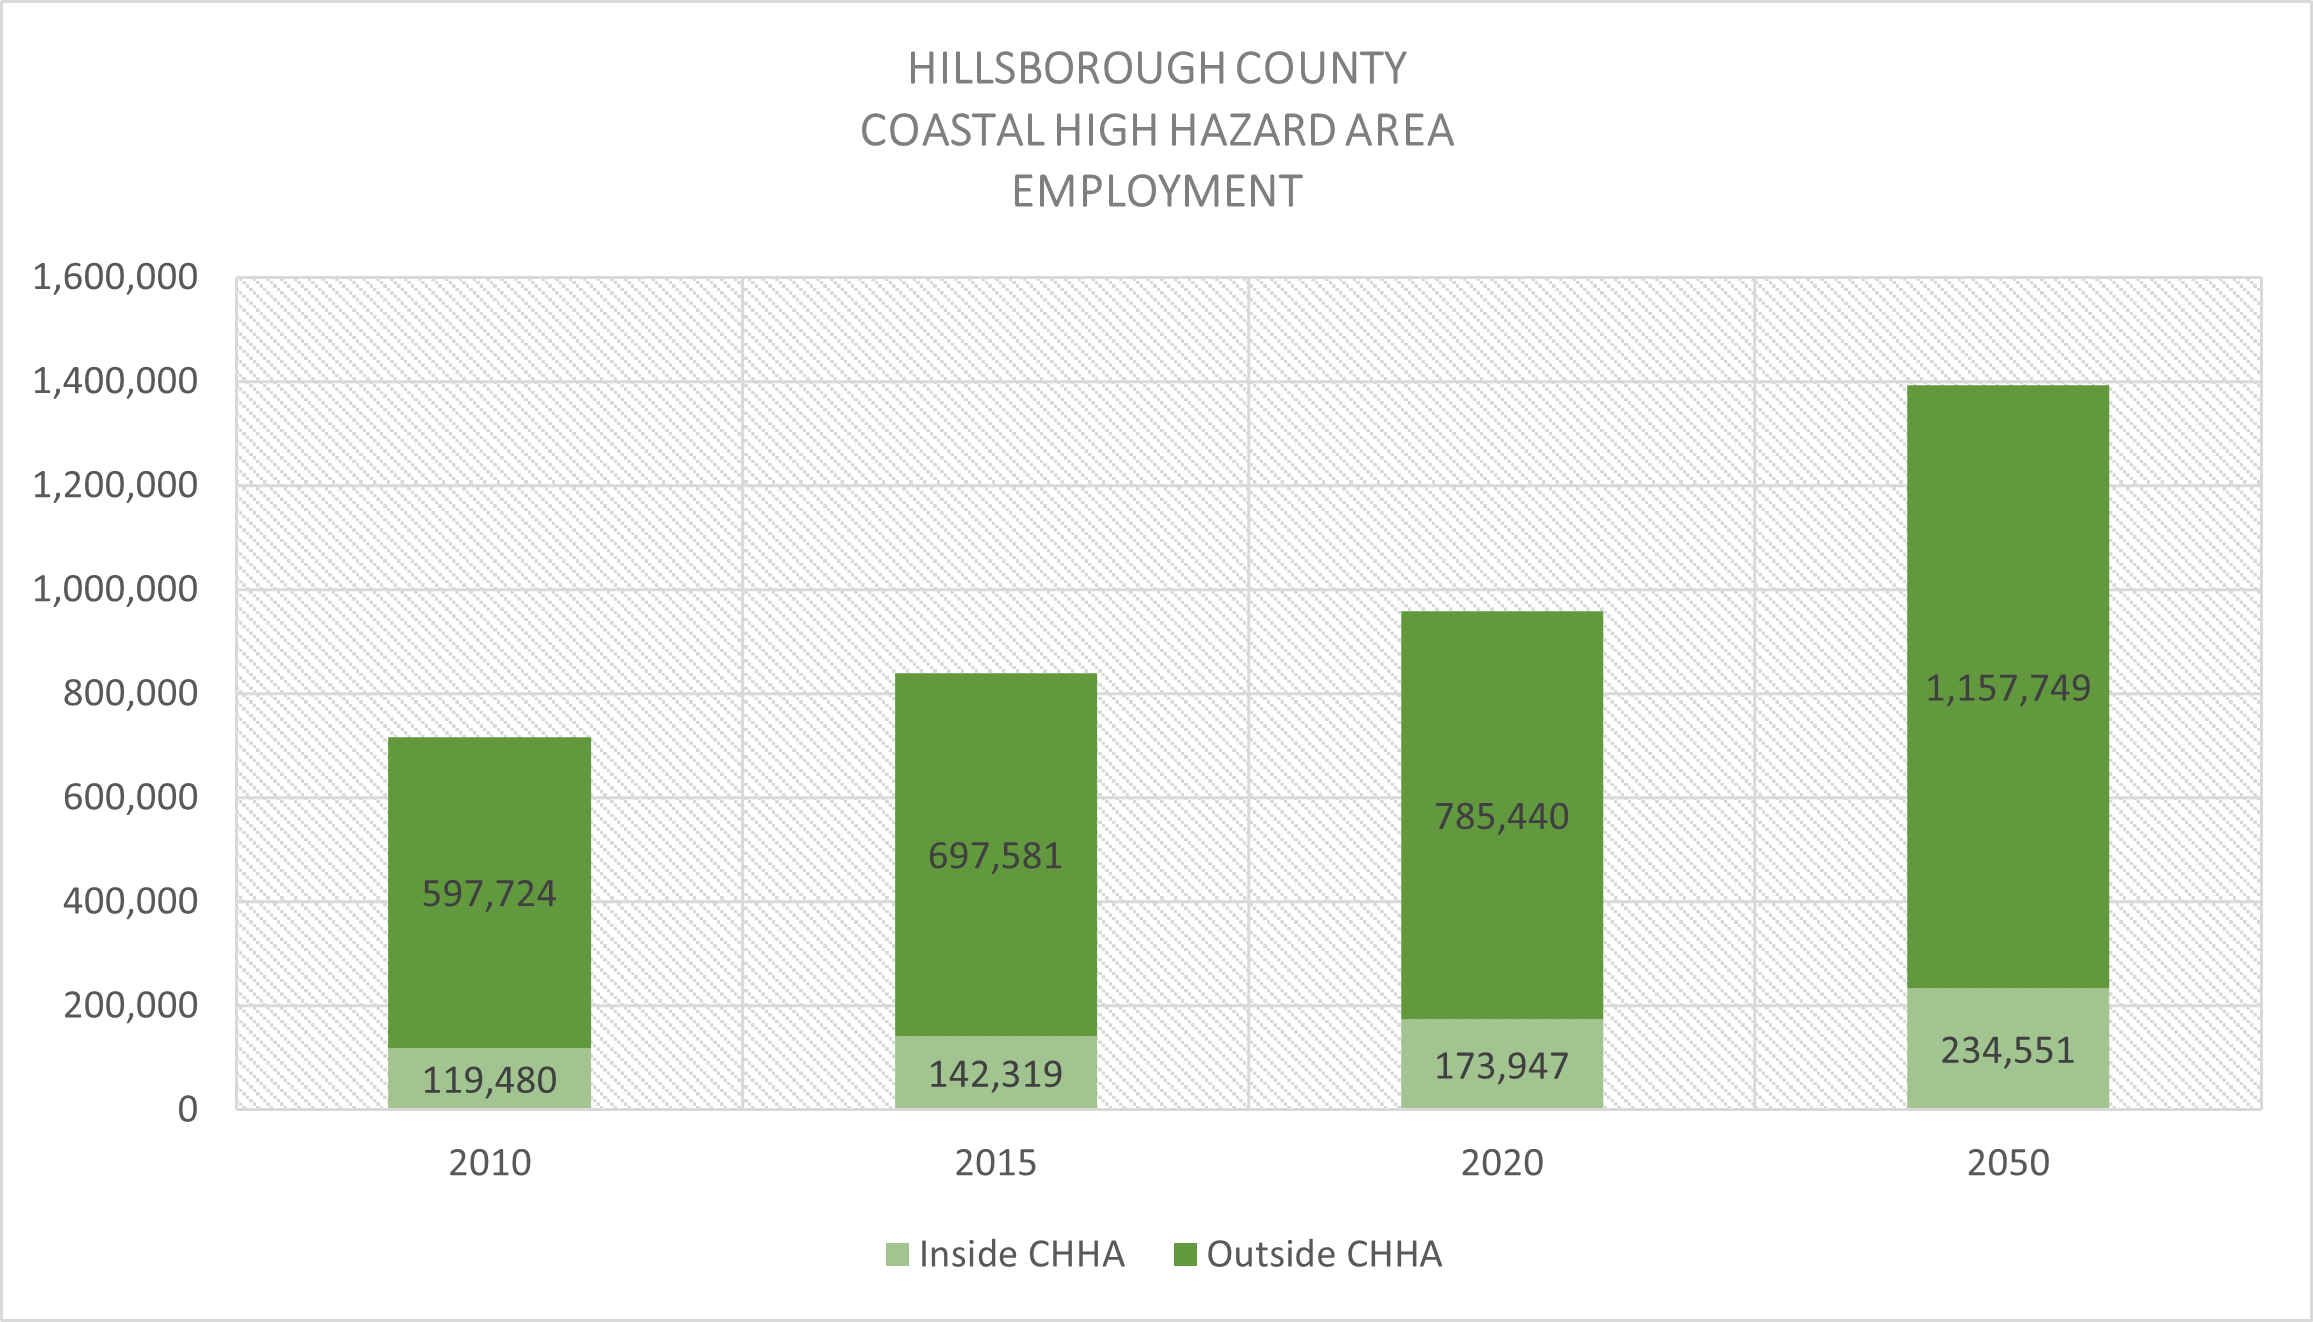
Figure 3b. Hillsborough County – Share of Employment inside and outside Coastal High Hazard Area

This chart shows Hillsborough County's share of jobs inside and outside the CHHA. Currently, 18% of the jobs are inside the CHHA and 82% of the jobs are outside CHHA. By 2050, the share of jobs inside the CHHA is expected to decrease slightly. Namely, 17% of the jobs will be inside the CHHA and 83% of the jobs will be outside CHHA.
This chart shows Hillsborough County’s share of jobs inside and outside the CHHA. Currently, 18% of the jobs are inside the CHHA and 82% of the jobs are outside CHHA. By 2050, the share of jobs inside the CHHA is expected to decrease slightly. Namely, 17% of the jobs will be inside the CHHA and 83% of the jobs will be outside CHHA.

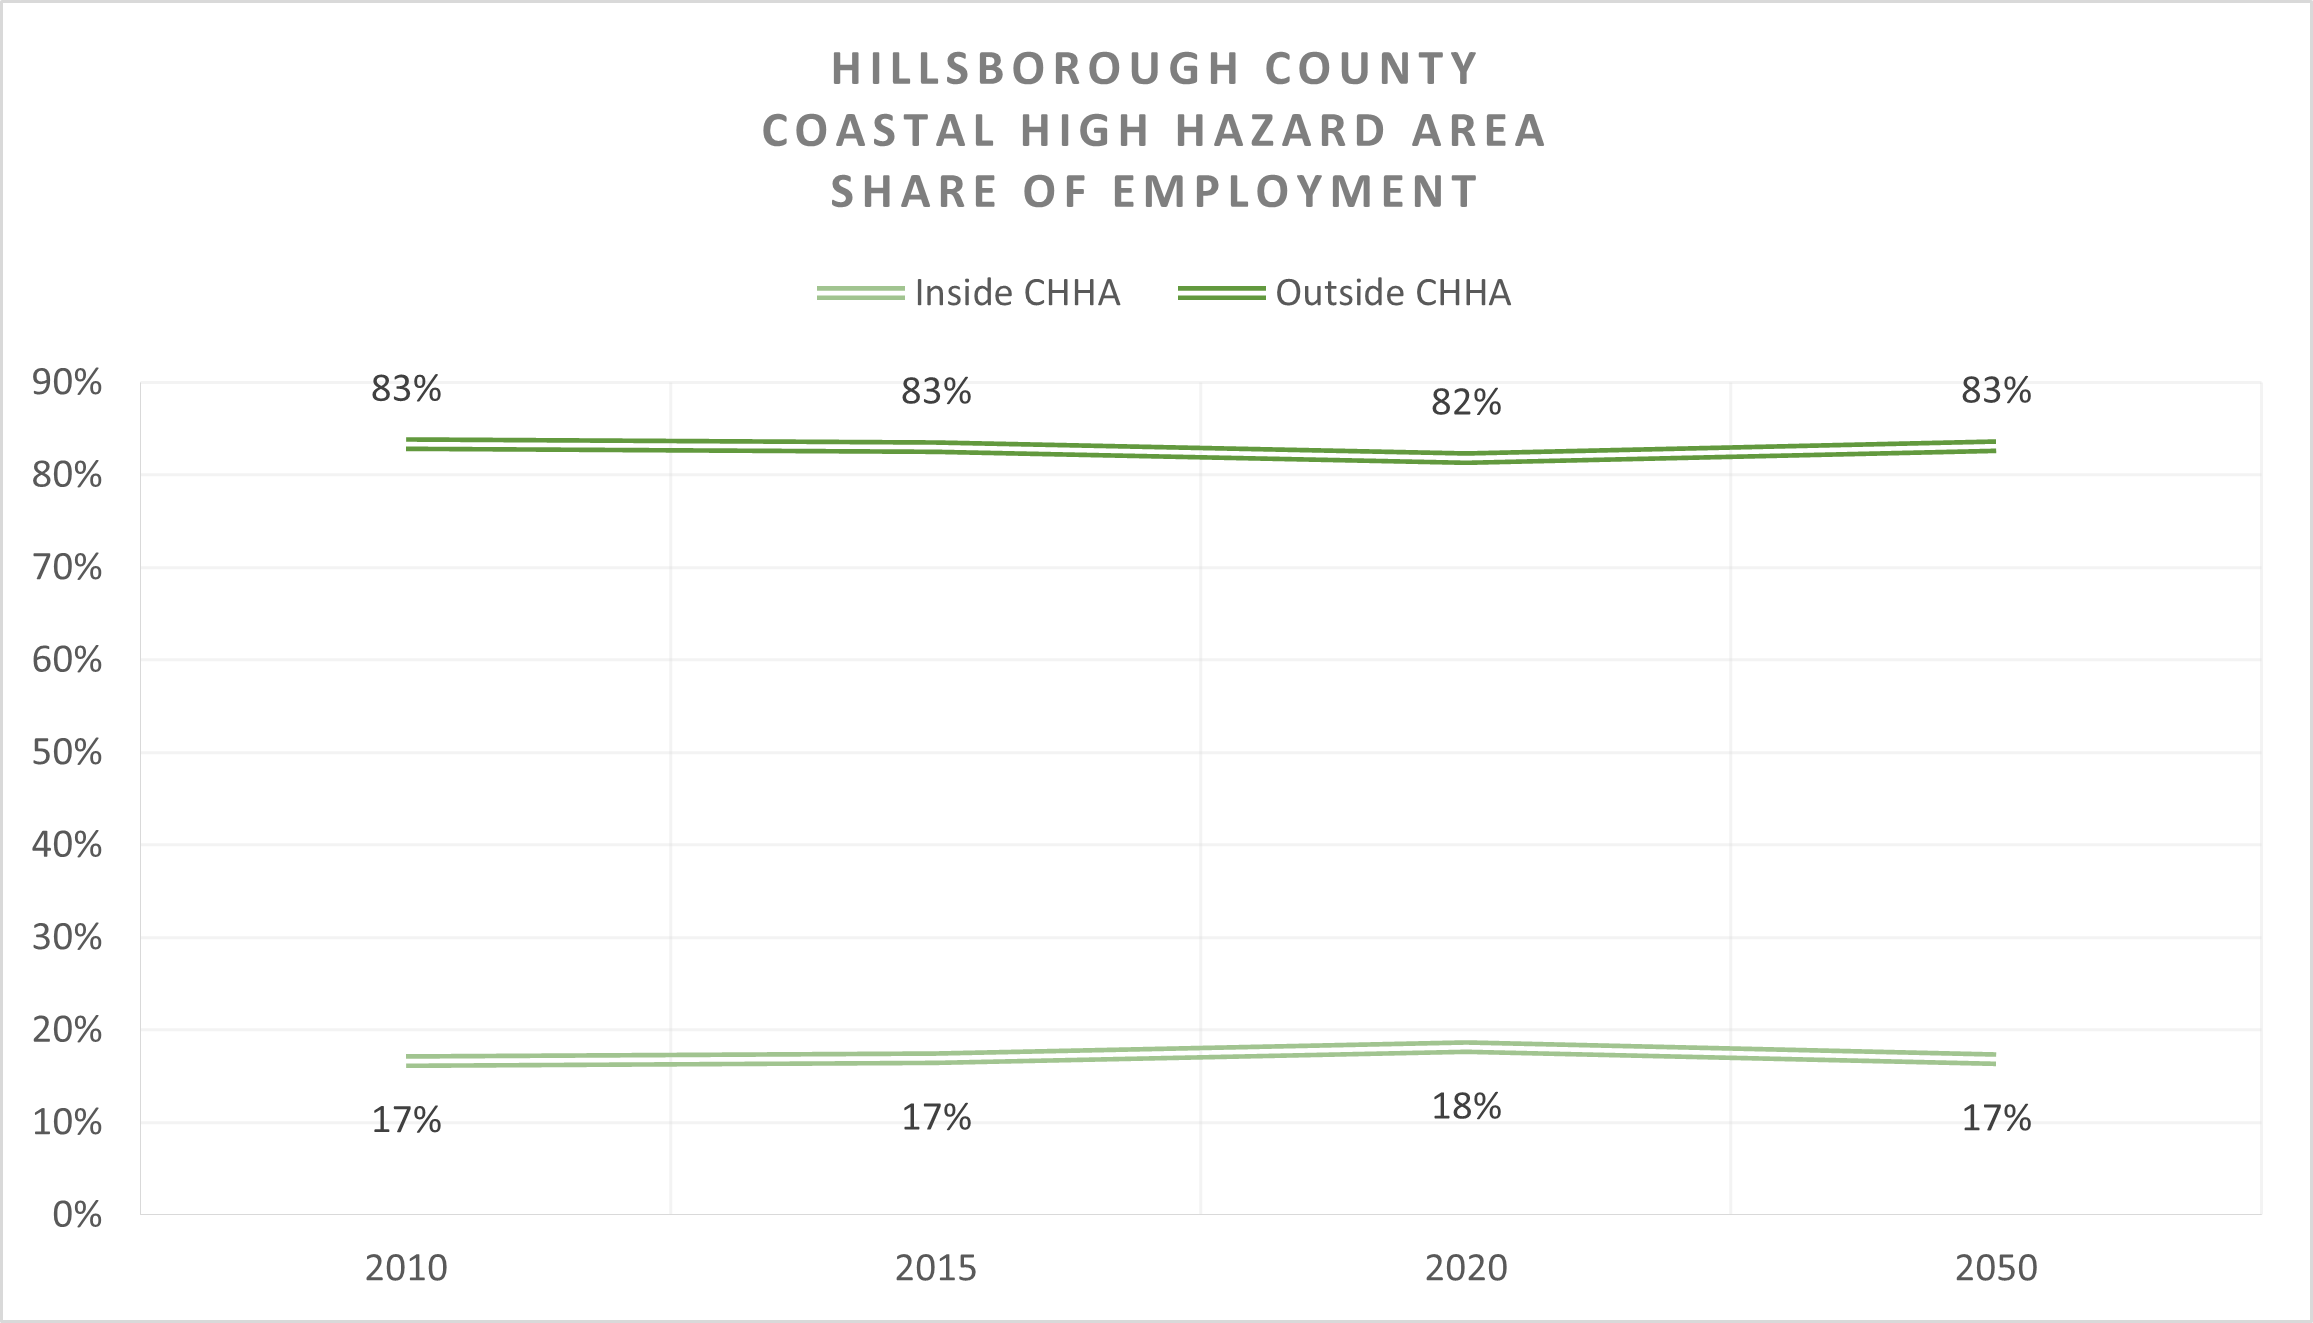
Figure 3c. Hillsborough County – New Employment inside and outside Coastal High Hazard Area

This chart shows Hillsborough County's new jobs inside and outside the CHHA. From 2015 to 2020, 31,627 new jobs moved inside the CHHA and 87,860 new jobs moved outside CHHA. From 2020 to 2050, 60,605 new jobs are expected to move inside the CHHA and 372,309 new jobs are expected to move outside the CHHA.
This chart shows Hillsborough County’s new jobs inside and outside the CHHA. From 2015 to 2020, 31,627 new jobs moved inside the CHHA and 87,860 new jobs moved outside CHHA. From 2020 to 2050, 60,605 new jobs are expected to move inside the CHHA and 372,309 new jobs are expected to move outside the CHHA.

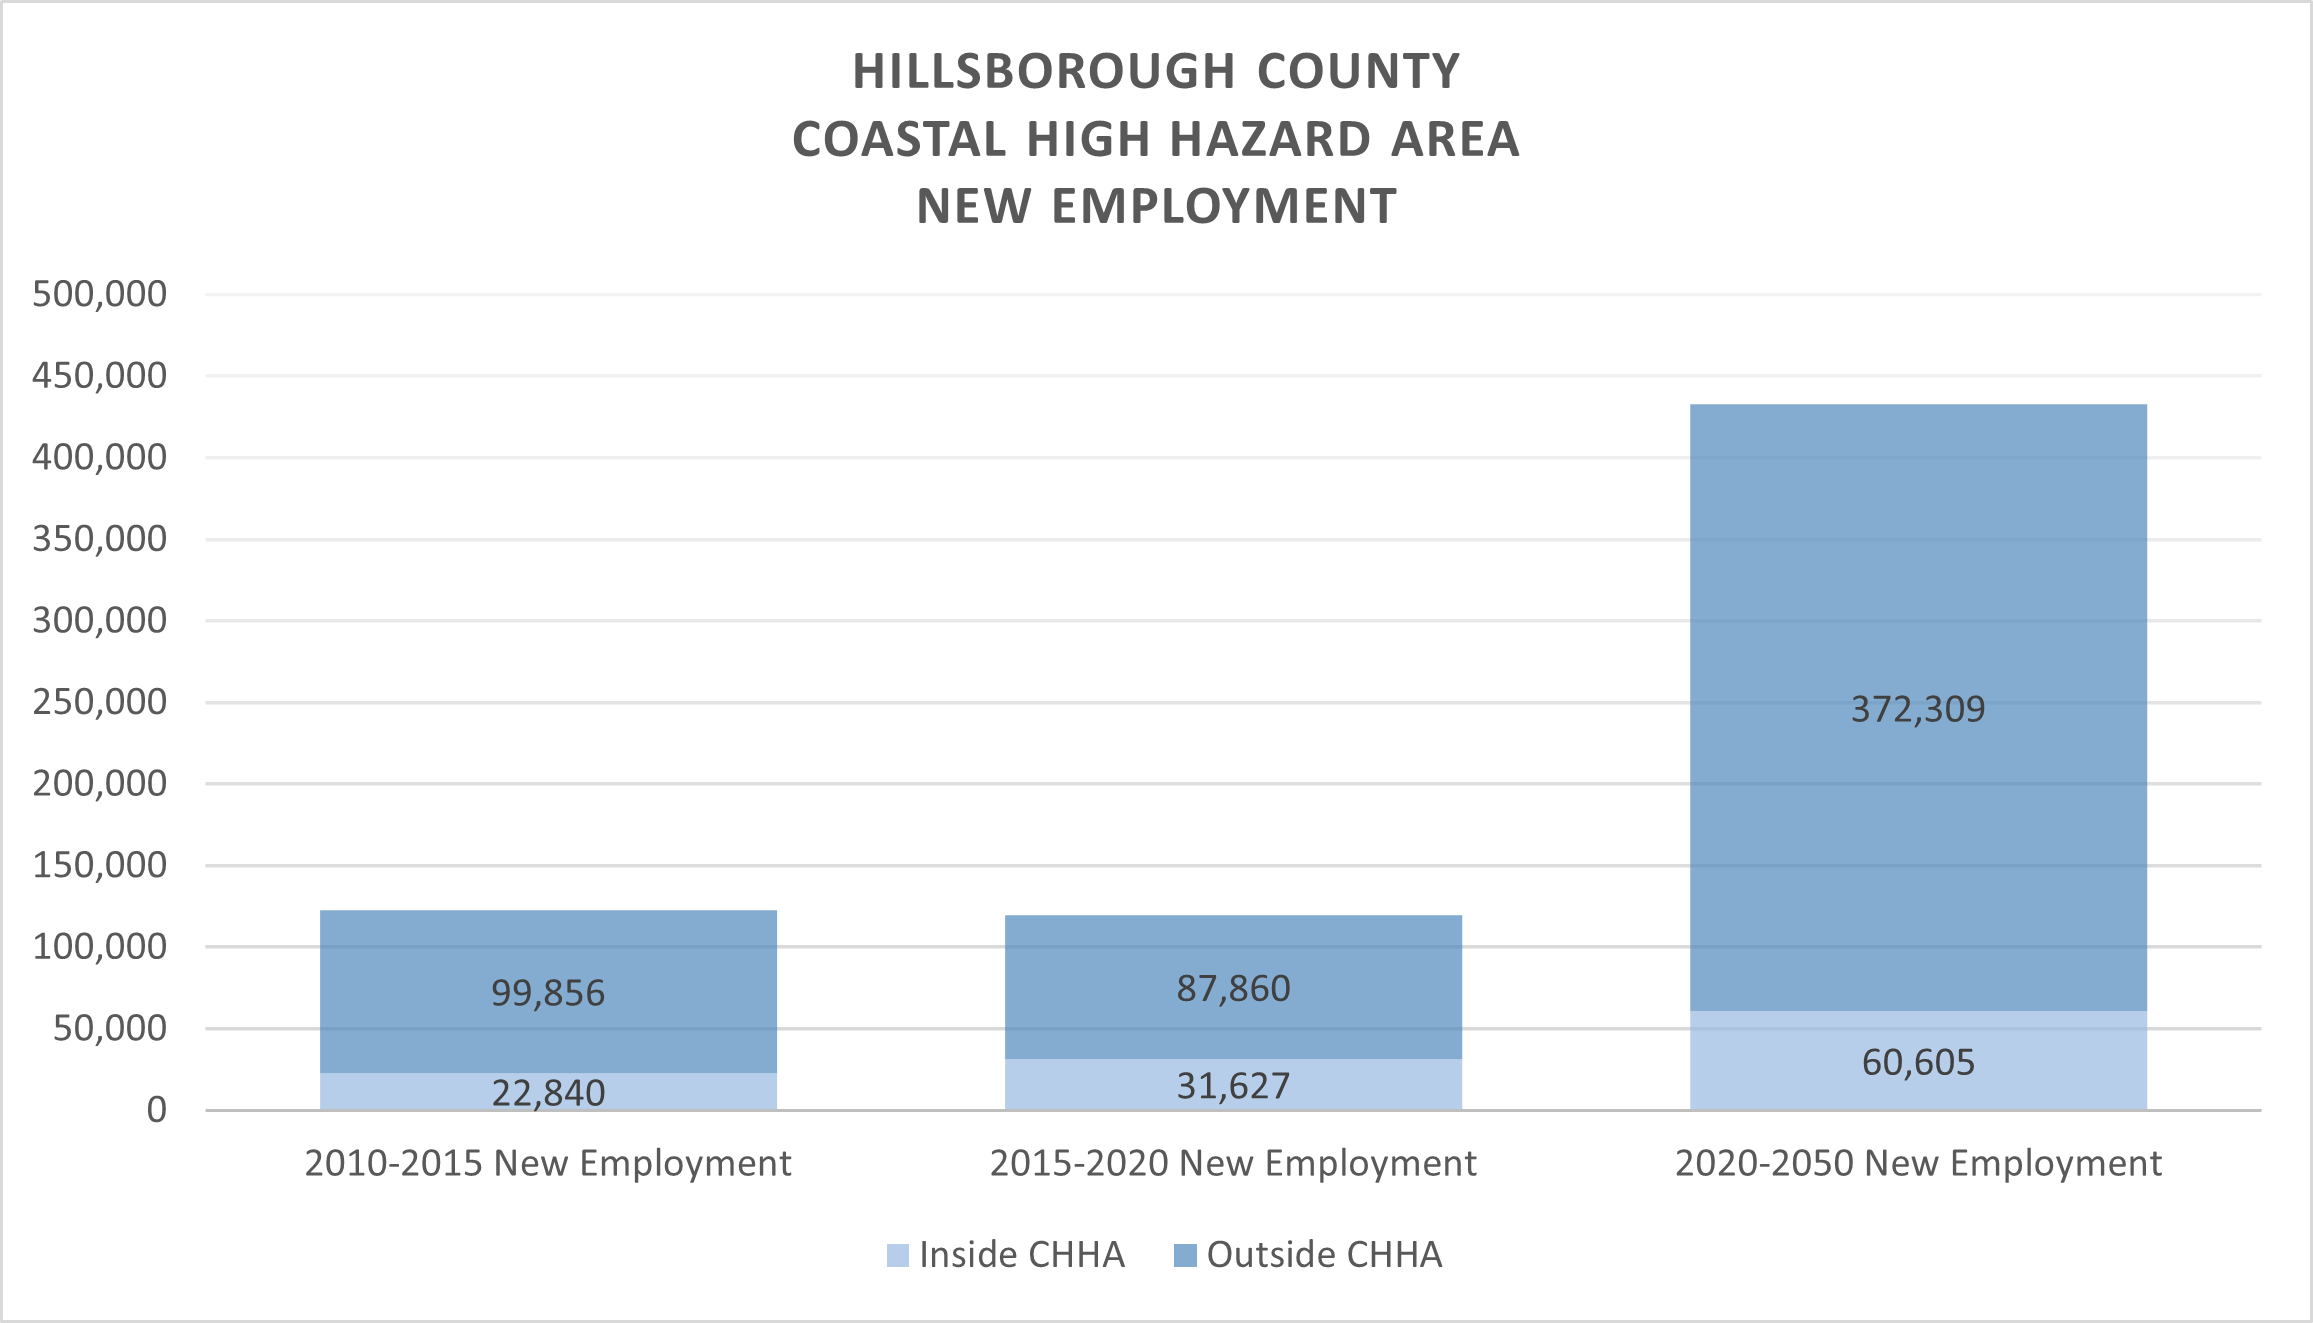
Figure 3d. Hillsborough County – Share of New Employment inside and outside Coastal High Hazard Area

This chart shows Hillsborough County's new jobs inside and outside the CHHA. From 2015 to 2020, 26% of the new jobs moved inside the CHHA and 74% of the new jobs moved outside CHHA. From 2020 to 2050, the share of new jobs inside CHHA is expected to decrease. Namely, 14% of the new jobs are expected to move inside the CHHA and 86% of the new jobs are expected to move outside CHHA.
This chart shows Hillsborough County’s new jobs inside and outside the CHHA. From 2015 to 2020, 26% of the new jobs moved inside the CHHA and 74% of the new jobs moved outside CHHA. From 2020 to 2050, the share of new jobs inside CHHA is expected to decrease. Namely, 14% of the new jobs are expected to move inside the CHHA and 86% of the new jobs are expected to move outside CHHA.

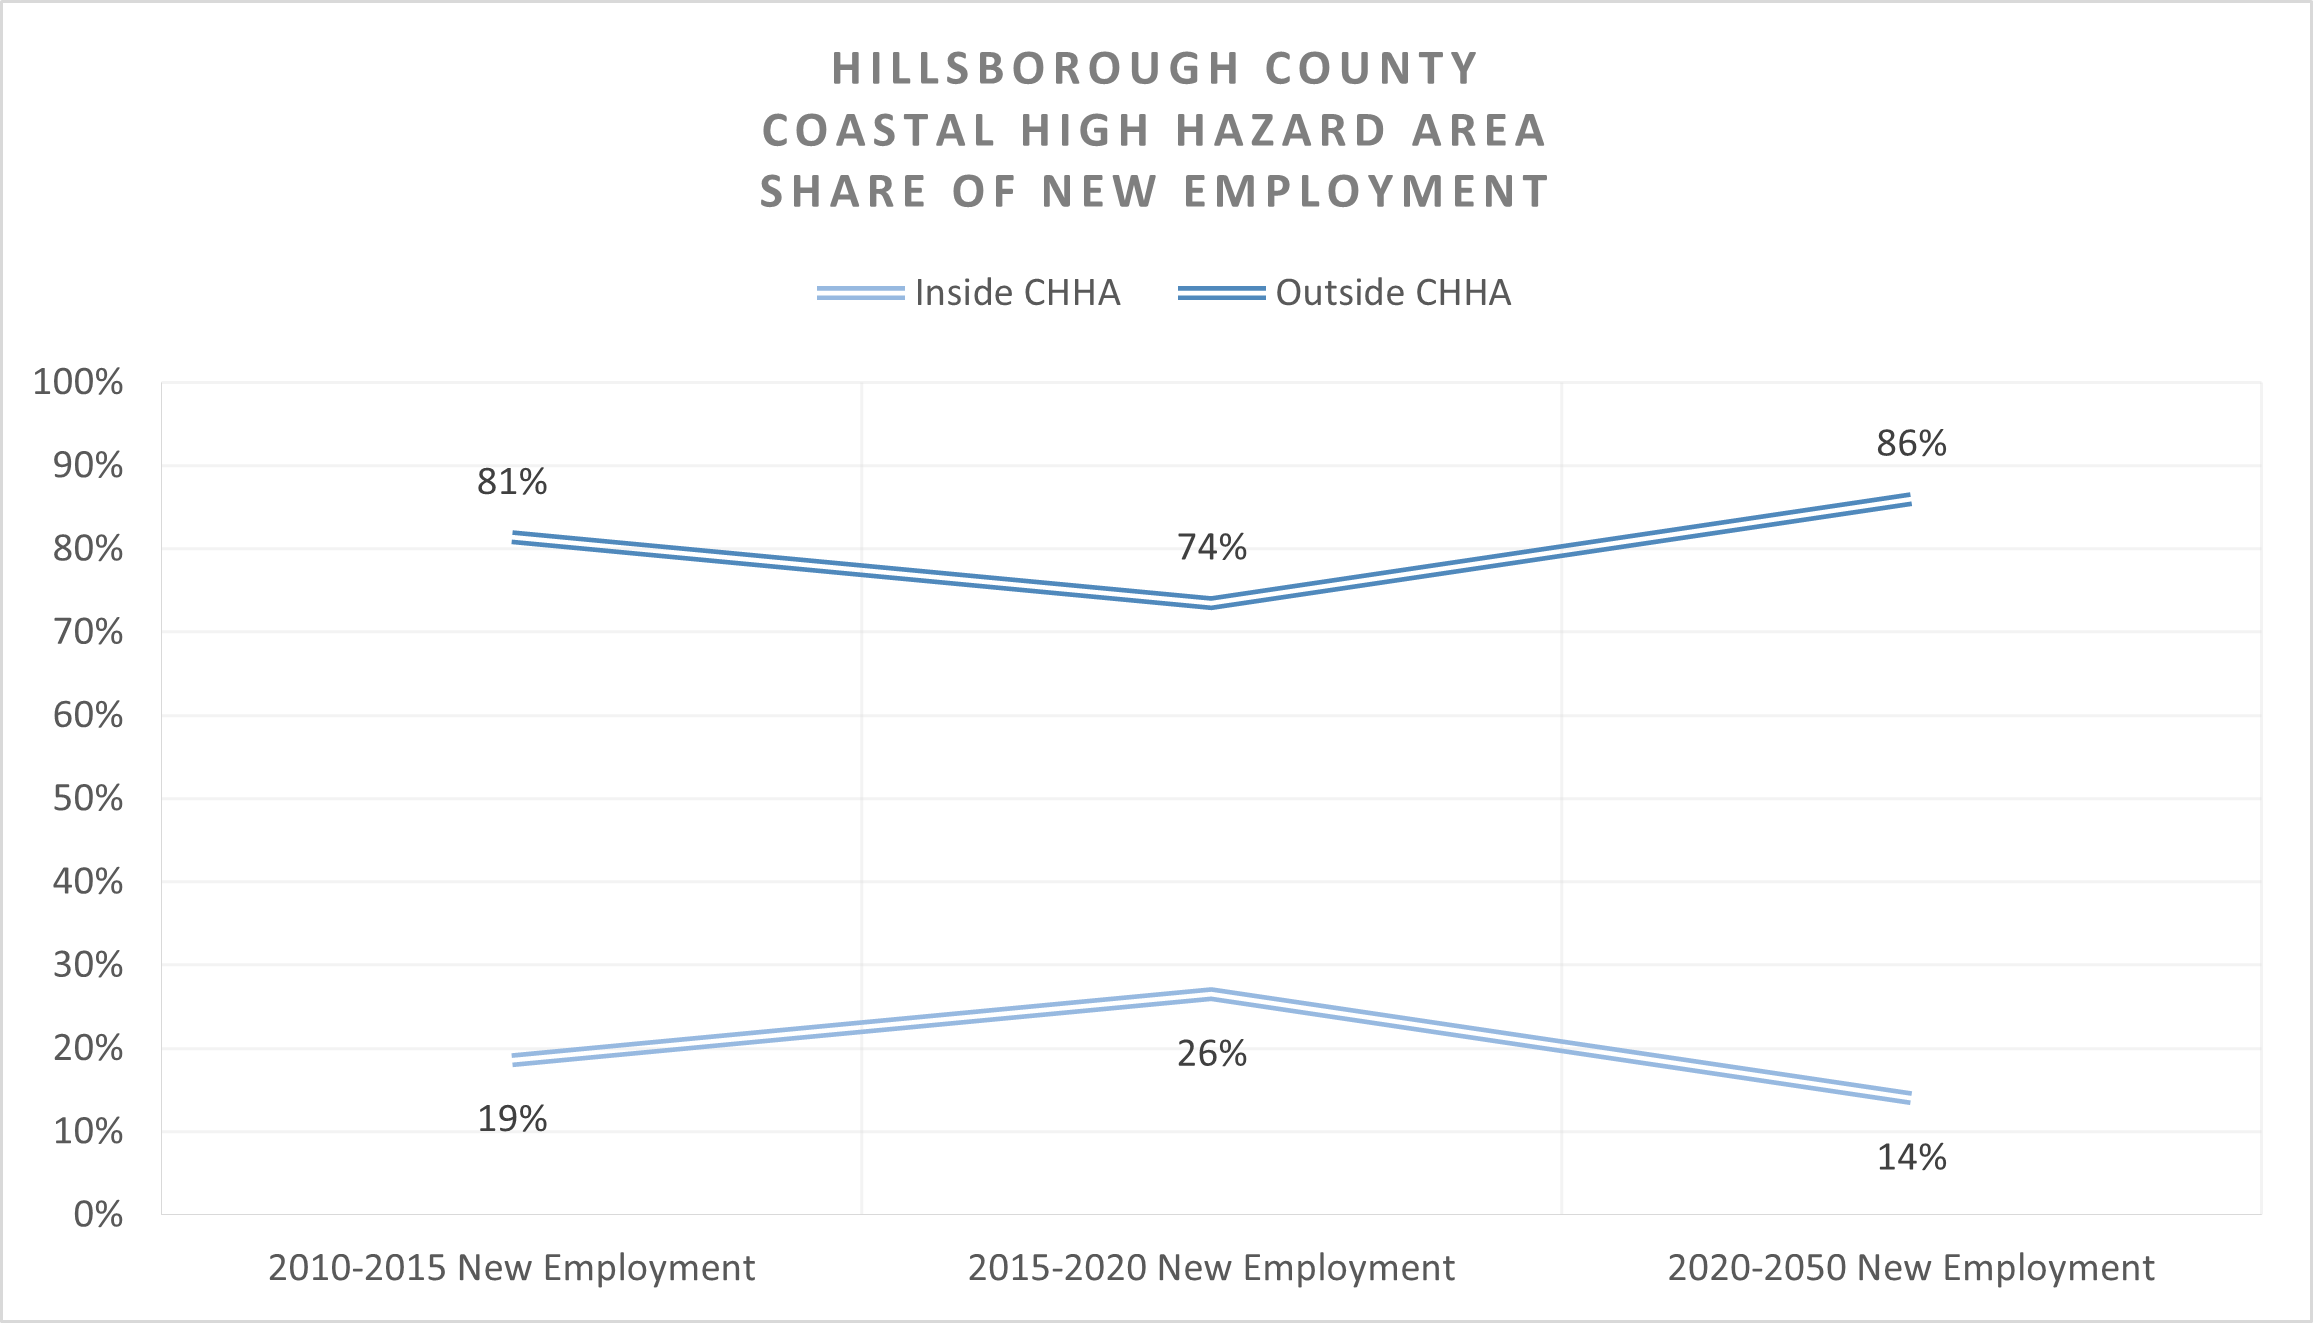
Figure 3e. Hillsborough County – Employment Since 2010 inside and outside Coastal High Hazard Area

This chart shows Hillsborough County's new jobs inside and outside the CHHA. From 2010 to 2020, 54,567new jobs moved inside the CHHA and 187,716 new jobs moved outside CHHA. From 2010 to 2050, 115,072 new jobs are expected to move inside the CHHA and 560,025 new jobs are expected to move outside the CHHA.
This chart shows Hillsborough County’s new jobs inside and outside the CHHA. From 2010 to 2020, 54,567new jobs moved inside the CHHA and 187,716 new jobs moved outside CHHA. From 2010 to 2050, 115,072 new jobs are expected to move inside the CHHA and 560,025 new jobs are expected to move outside the CHHA.

Figure 3f. Hillsborough County – Share of New Employment inside and outside Coastal High Hazard Area

This chart shows Hillsborough County's new jobs inside and outside the CHHA. From 2010 to 2020, 22% of the new jobs moved inside the CHHA and 78% of new jobs moved outside CHHA. From 2010 to 2050, the share are expected to change. Namely, 17% of the new jobs are expected to move inside the CHHA and 83% of the new jobs are expected to move outside CHHA.
This chart shows Hillsborough County’s new jobs inside and outside the CHHA. From 2010 to 2020, 22% of the new jobs moved inside the CHHA and 78% of new jobs moved outside CHHA. From 2010 to 2050, the share are expected to change. Namely, 17% of the new jobs are expected to move inside the CHHA and 83% of the new jobs are expected to move outside CHHA.

Figure 3g. Hillsborough County – New Employment per Acre Through 2050

This map shows new jobs per acre through 2050 for Hillsborough County. The map shows Tampa's planning districts, UHC's unincorporated planning areas, and the coastal high hazard area (hatched). Darker green areas denote a higher number of new jobs per acre through 2050.
This map shows new jobs per acre through 2050 for Hillsborough County. The map shows Tampa’s planning districts, UHC’s unincorporated planning areas, and the coastal high hazard area (hatched). Darker green areas denote a higher number of new jobs per acre through 2050.

Conclusion

To conclude, we presented population and employment projections within the Coastal High Hazard Area based on adopted Future Land Uses’ densities and intensities. These densities and intensities are not new and were adopted well before these projections were developed. Currently, 155,212 persons live in the CHHA (10% of the county’s population). By 2050, the population residing in the CHHA will reach 216,010 persons (39% higher than 2020). They would represent 11% of the 2050 population (only 1% higher than the 2010 share). In terms of employment, there are 173,947 jobs in the CHHA (18% of the county’s 2020 jobs). By 2050, jobs in the CHHA will reach 234,551 persons (35% higher than 2020). They would will represent 17% of the county’s 2050 projected jobs (slightly lower than the 2020 share).


[ii] “The Coastal High Hazard Area is an area particularly vulnerable to the effects of coastal flooding from tropical storm events and is defined by section 163.3178(2)(h)9, Florida Statutes, as the area below the elevation of the category 1 storm surge line as established by a Sea, Lake, and Overland Surges from Hurricanes (SLOSH) computerized storm surge model.” Source: https://www.floridajobs.org/community-planning-and-development/programs/community-planning-table-of-contents/coastal-high-hazard-areas#:~:text=The%20Coastal%20High%20Hazard%20Area,and%20Overland%20Surges%20from%20Hurricanes