


Published
March 27, 2024
Contact
Yassert A. Gonzalez
Manager – Economics, Demographics & Research
813-582-7356 (o)
[email protected]
planhillsborough.org
Last updated
April 8, 2024
Every five years Planning Commission staff conducts a collaborative exercise which results in new long-range growth forecasts. Land use planners from all jurisdictions were invited to comment on the initial draft. The final draft and all supporting documentation are found here: 2050 Long Range Growth Forecasts. This is the ninth blog in this series. To read previous blogs discussing other areas within Hillsborough County, kindly visit our Demographic and Economic Data Page.
This month we are reviewing 2050 projections for the four Planning Districts in Tampa partially within the Coastal High Hazard Area (CHHA)[ii]. The CHHA comprises coastal lands that have a significantly higher probability of flood and wind damage during storm events due to their proximity to large bodies of water. It is updated periodically and defined by statute. Moreover, local comprehensive plans contain policy language to help mitigate the overall hazard due to the potential of coastal flooding. As seen in Figure 1, 4 of 5 Tampa Planning Districts are partially within the CHHA. Only the New Tampa Planning District is completely outside the CHHA.
In terms of densities and intensities within CHHA, we used publicly discussed and adopted Future Land Use categories. These were adopted well before these planning projections were published. Below, we will be reviewing projections for Tampa’s planning districts partially within the CHHA. As seen in Figure 1, 4 of 5 Tampa Planning Districts are partially within the CHHA. City and Planning Commission staff are currently holding public meetings on policy language that may affect potential density and intensity increases inside CHHA areas via comprehensive plan amendments.
Figure 1. Tampa’s Planing Districts in relation to Coastal High Hazard Area
Population Growth in the CHHA
In Tampa, from 2010 to 2020, the population inside the CHHA grew to 66,986 people (13,126 new residents and 24% higher than 2010). Currently, 17% of the city’s population lives inside the CHHA. Simultaneously, from 2010 to 2020, the city’s population outside the CHHA grew to 325,967 people (44,118 new residents or 16% higher than 2010). By 2050, we expect the city’s population inside the CHHA to reach 95,645 people (28,659 new residents or 43% higher than the 2020 population). By 2050, the share of the city’s population inside the CHHA is expected to increase slightly to 19%. From 2010 through 2020, the areas of the Central Tampa and South Tampa Planning Districts inside the CHHA attracted the largest number of new residents moving to CHHA inside Tampa (37% and 56%% of all new residents to the CHHA in Tampa, respectively). From 2020 through 2050, the areas in the Central Tampa and South Tampa Planning Districts inside the CHHA are also expected to attract the largest number of new residents moving to the CHHA inside Tampa (35% and 61% of all expected new residents to the CHHA in Tampa, respectively). Meanwhile, the city’s population 2020-2050 percent growth outside the CHHA would be lower. By 2050, the city’s population outside the CHHA is expected to reach 397,591 people (71,624 new residents or 22% higher than the 2020 population). See Table 2 and Figures 3a-3g.
Table 2. Tampa – Population Estimates and Projections Inside and Outside the CHHA
| Tampa Planning Districts Partially Inside CHHA | 2010 | 2015 | 2020 | 2050 | 2010-2020 New Residents | 2010-2020 Percent Change | 2020-2050 New Residents | 2020-2050 Percent Change |
| Central Tampa | 18,338 | 19,696 | 23,186 | 33,145 | 4,849 | 26% | 9,959 | 43% |
| South Tampa | 32,146 | 34,812 | 39,529 | 57,063 | 7,383 | 23% | 17,534 | 44% |
| USF Institutional | 513 | 530 | 535 | 1,064 | 22 | 4% | 529 | 99% |
| Westshore TIA | 2,864 | 2,917 | 3,736 | 4,373 | 872 | 30% | 638 | 17% |
| Tampa CHHA Total | 53,861 | 57,955 | 66,986 | 95,645 | 13,126 | 24% | 28,659 | 43% |
| Inside CHHA | 53,861 | 57,955 | 66,986 | 95,645 | 13,126 | 24% | 28,659 | 43% |
| Outside CHHA | 281,848 | 300,324 | 325,967 | 397,591 | 44,118 | 16% | 71,624 | 22% |
| Tampa Total | 335,709 | 358,279 | 392,953 | 493,236 | 57,244 | 17% | 100,283 | 26% |
Figure 3a. Tampa – Population inside and outside Coastal High Hazard Area
Figure 3b. Tampa – Share of Population inside and outside Coastal High Hazard Area
Figure 3c. Tampa – New Residents inside and outside Coastal High Hazard Area
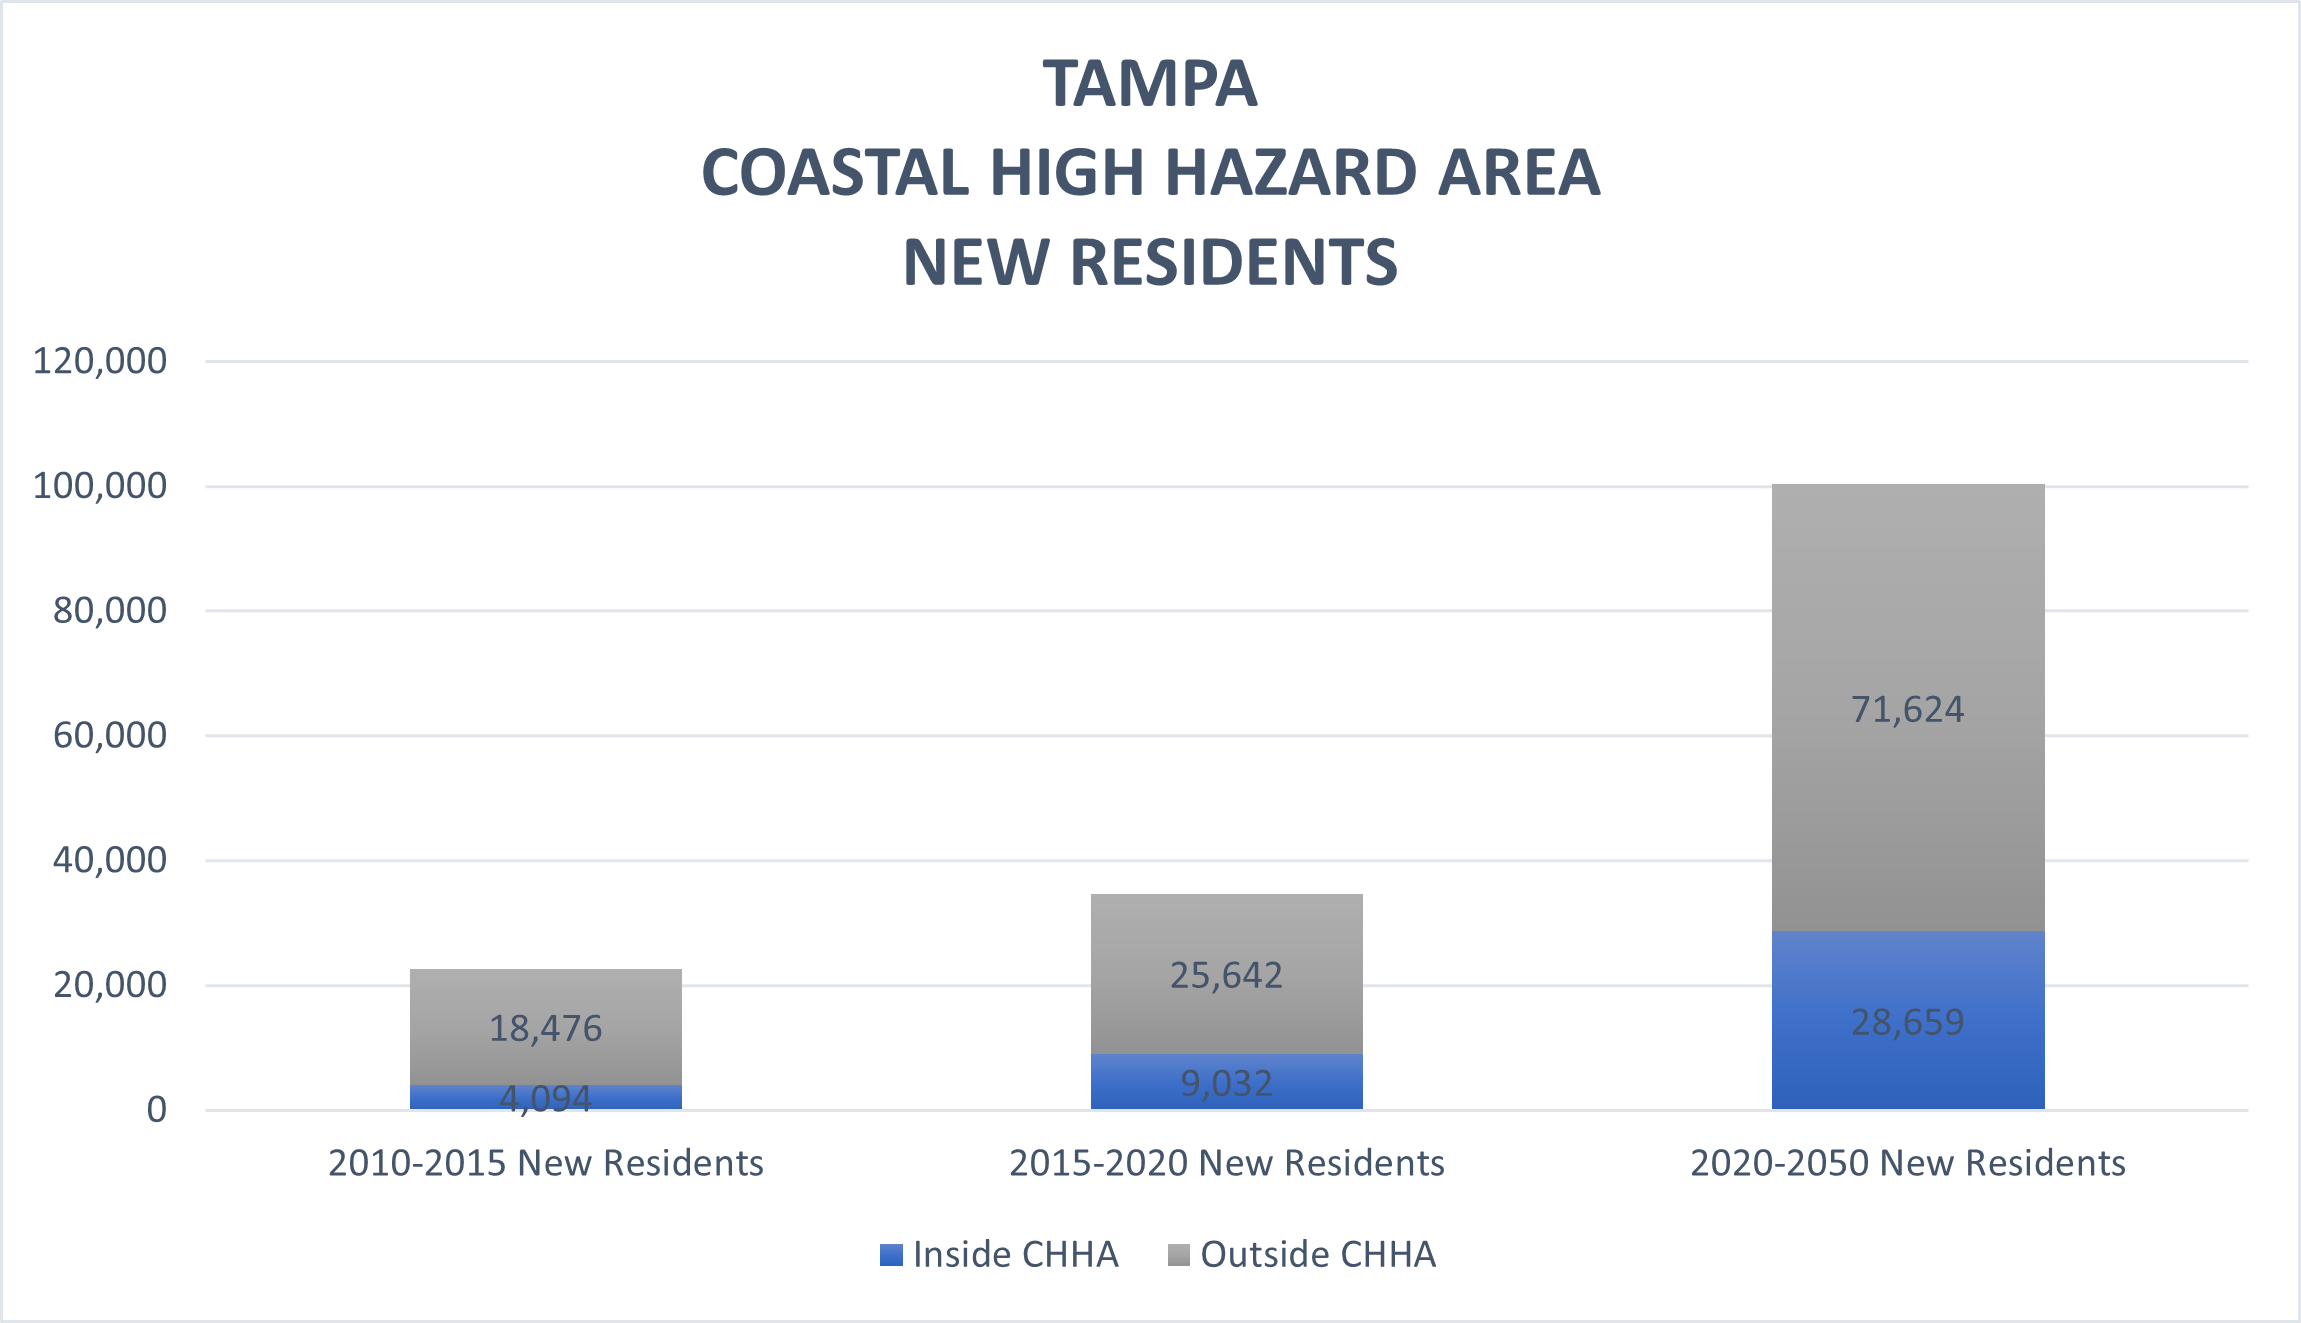
Figure 3d. Tampa – Share of New Residents inside and outside Coastal High Hazard Area
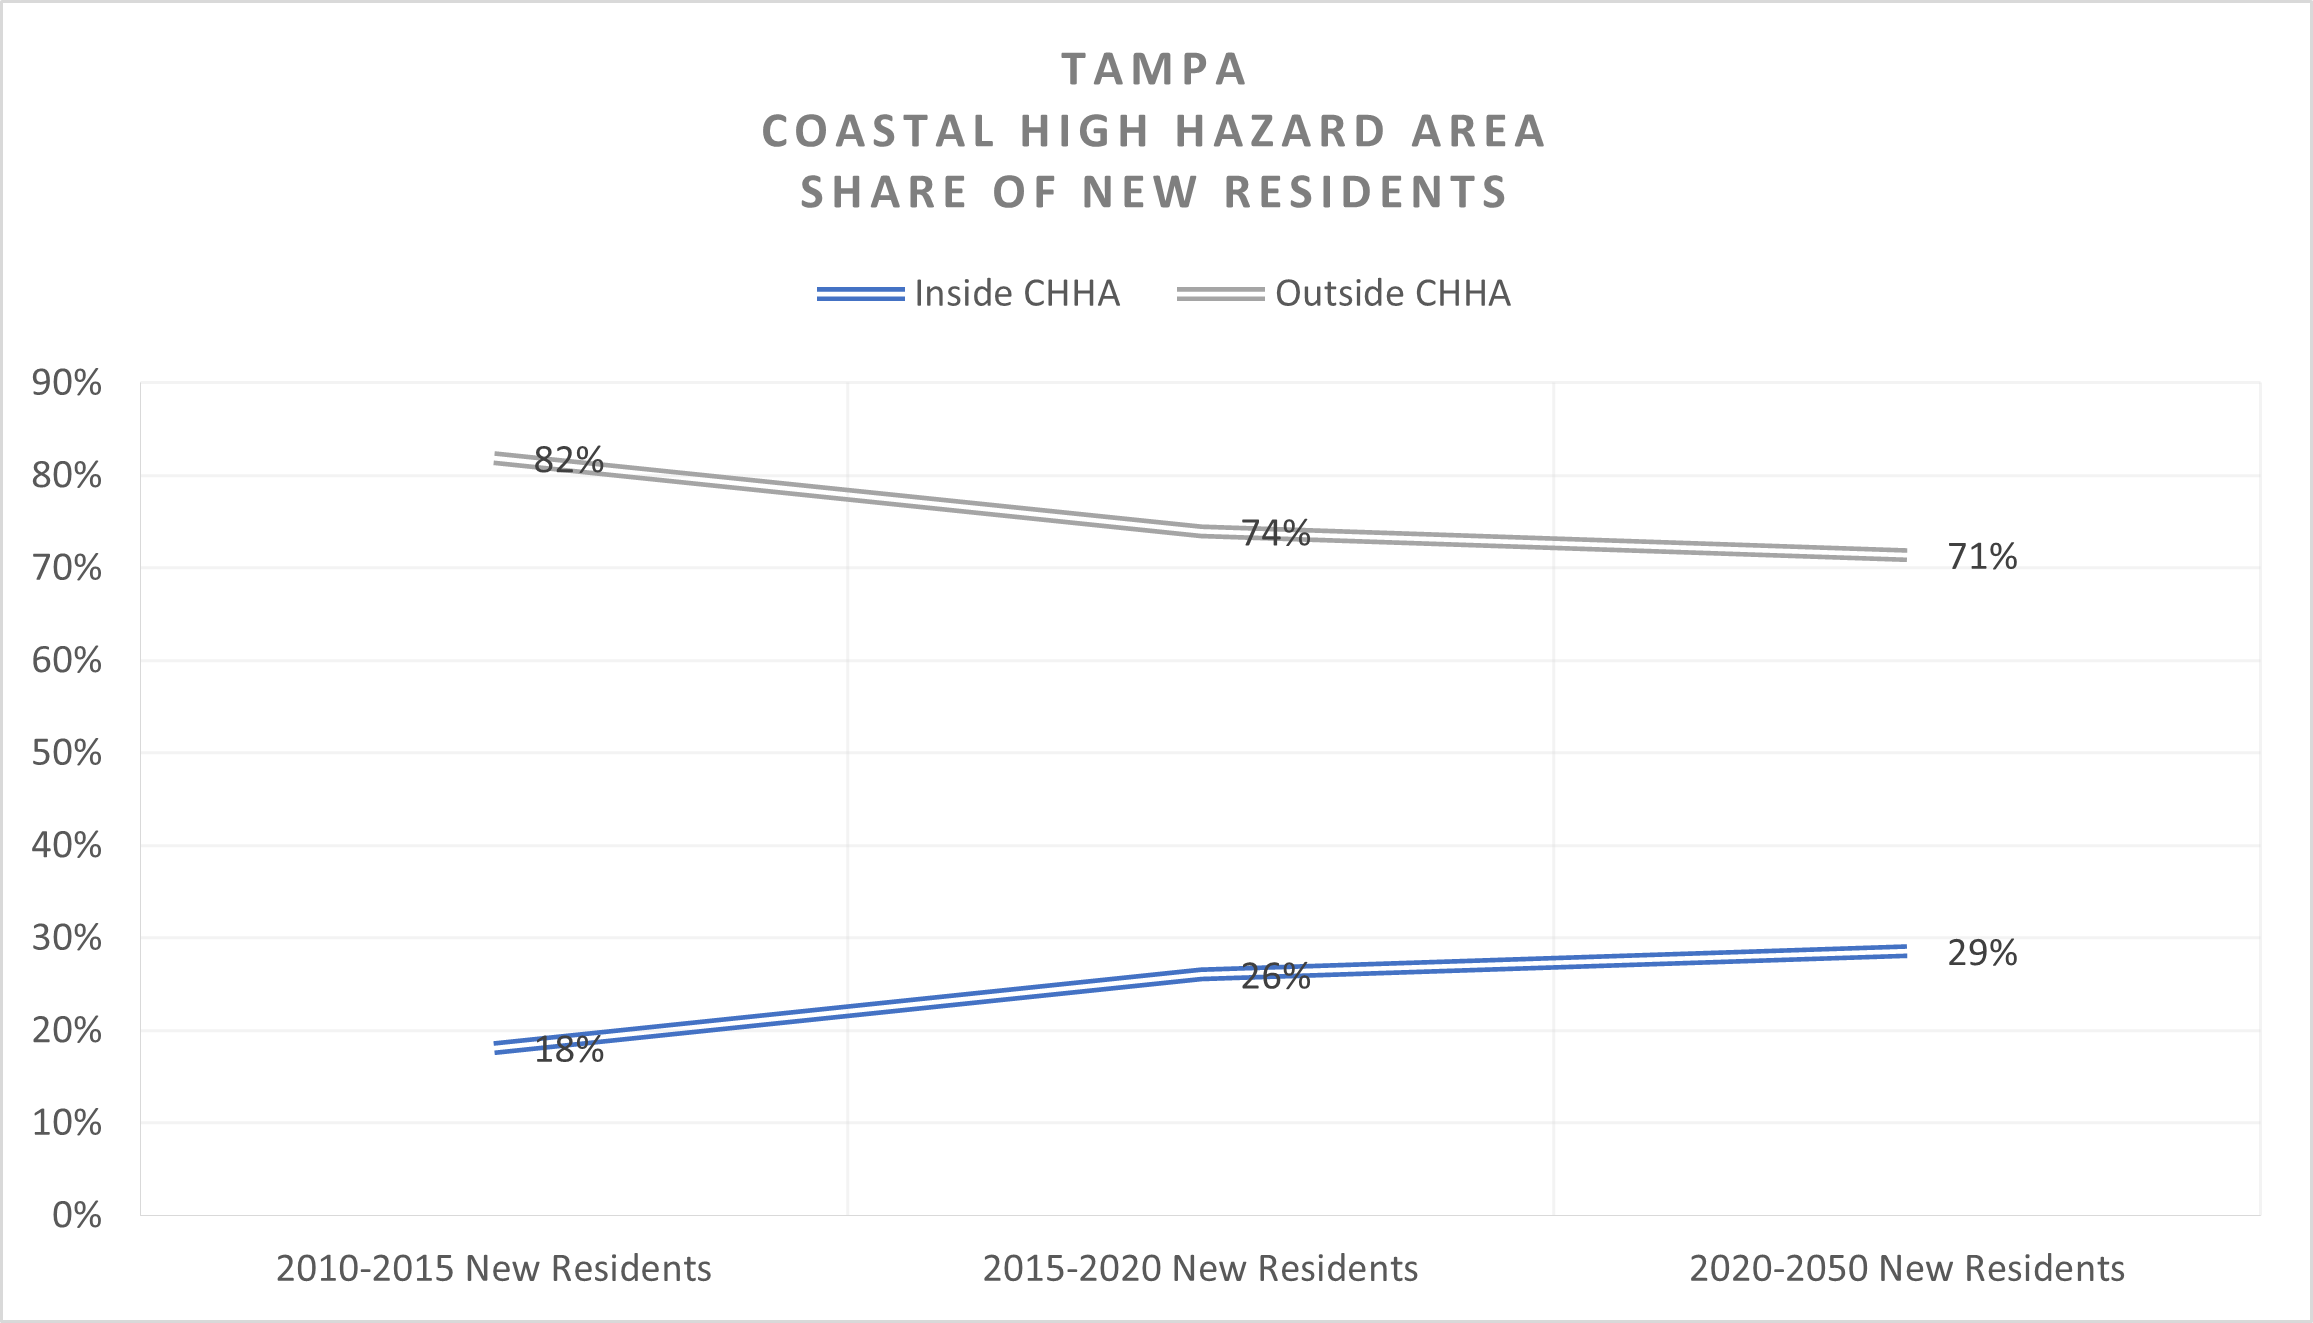
Figure 3e. Tampa – New Residents Since 2010 inside and outside Coastal High Hazard Area
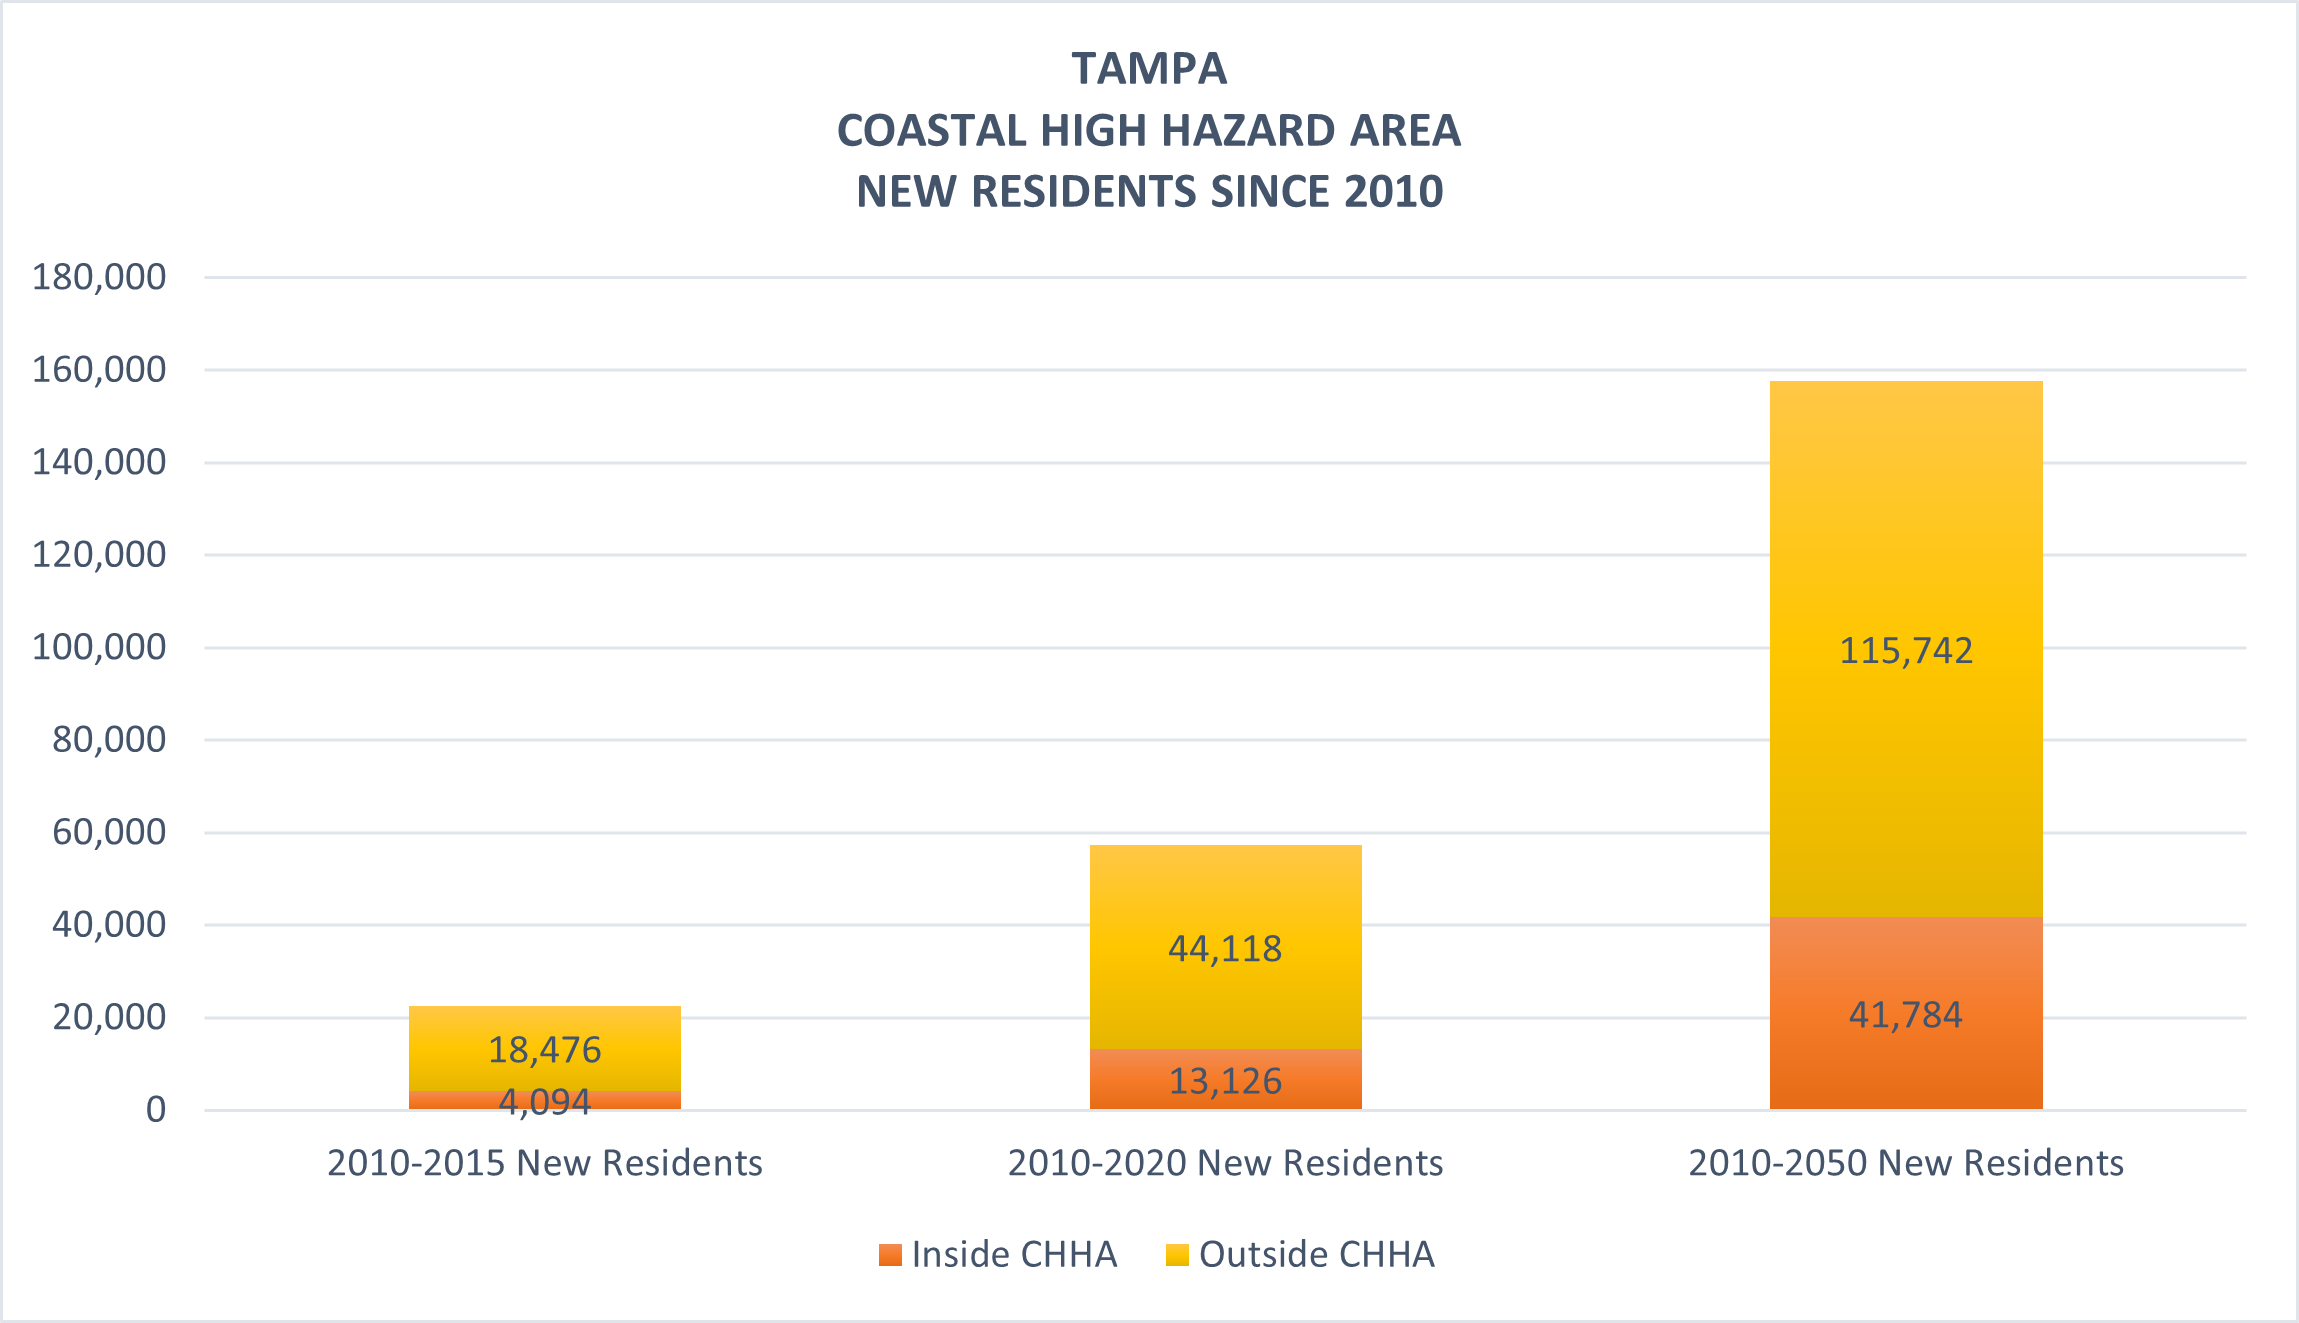
Figure 3f. Tampa – Share of New Residents Since 2010 inside and outside Coastal High Hazard Area
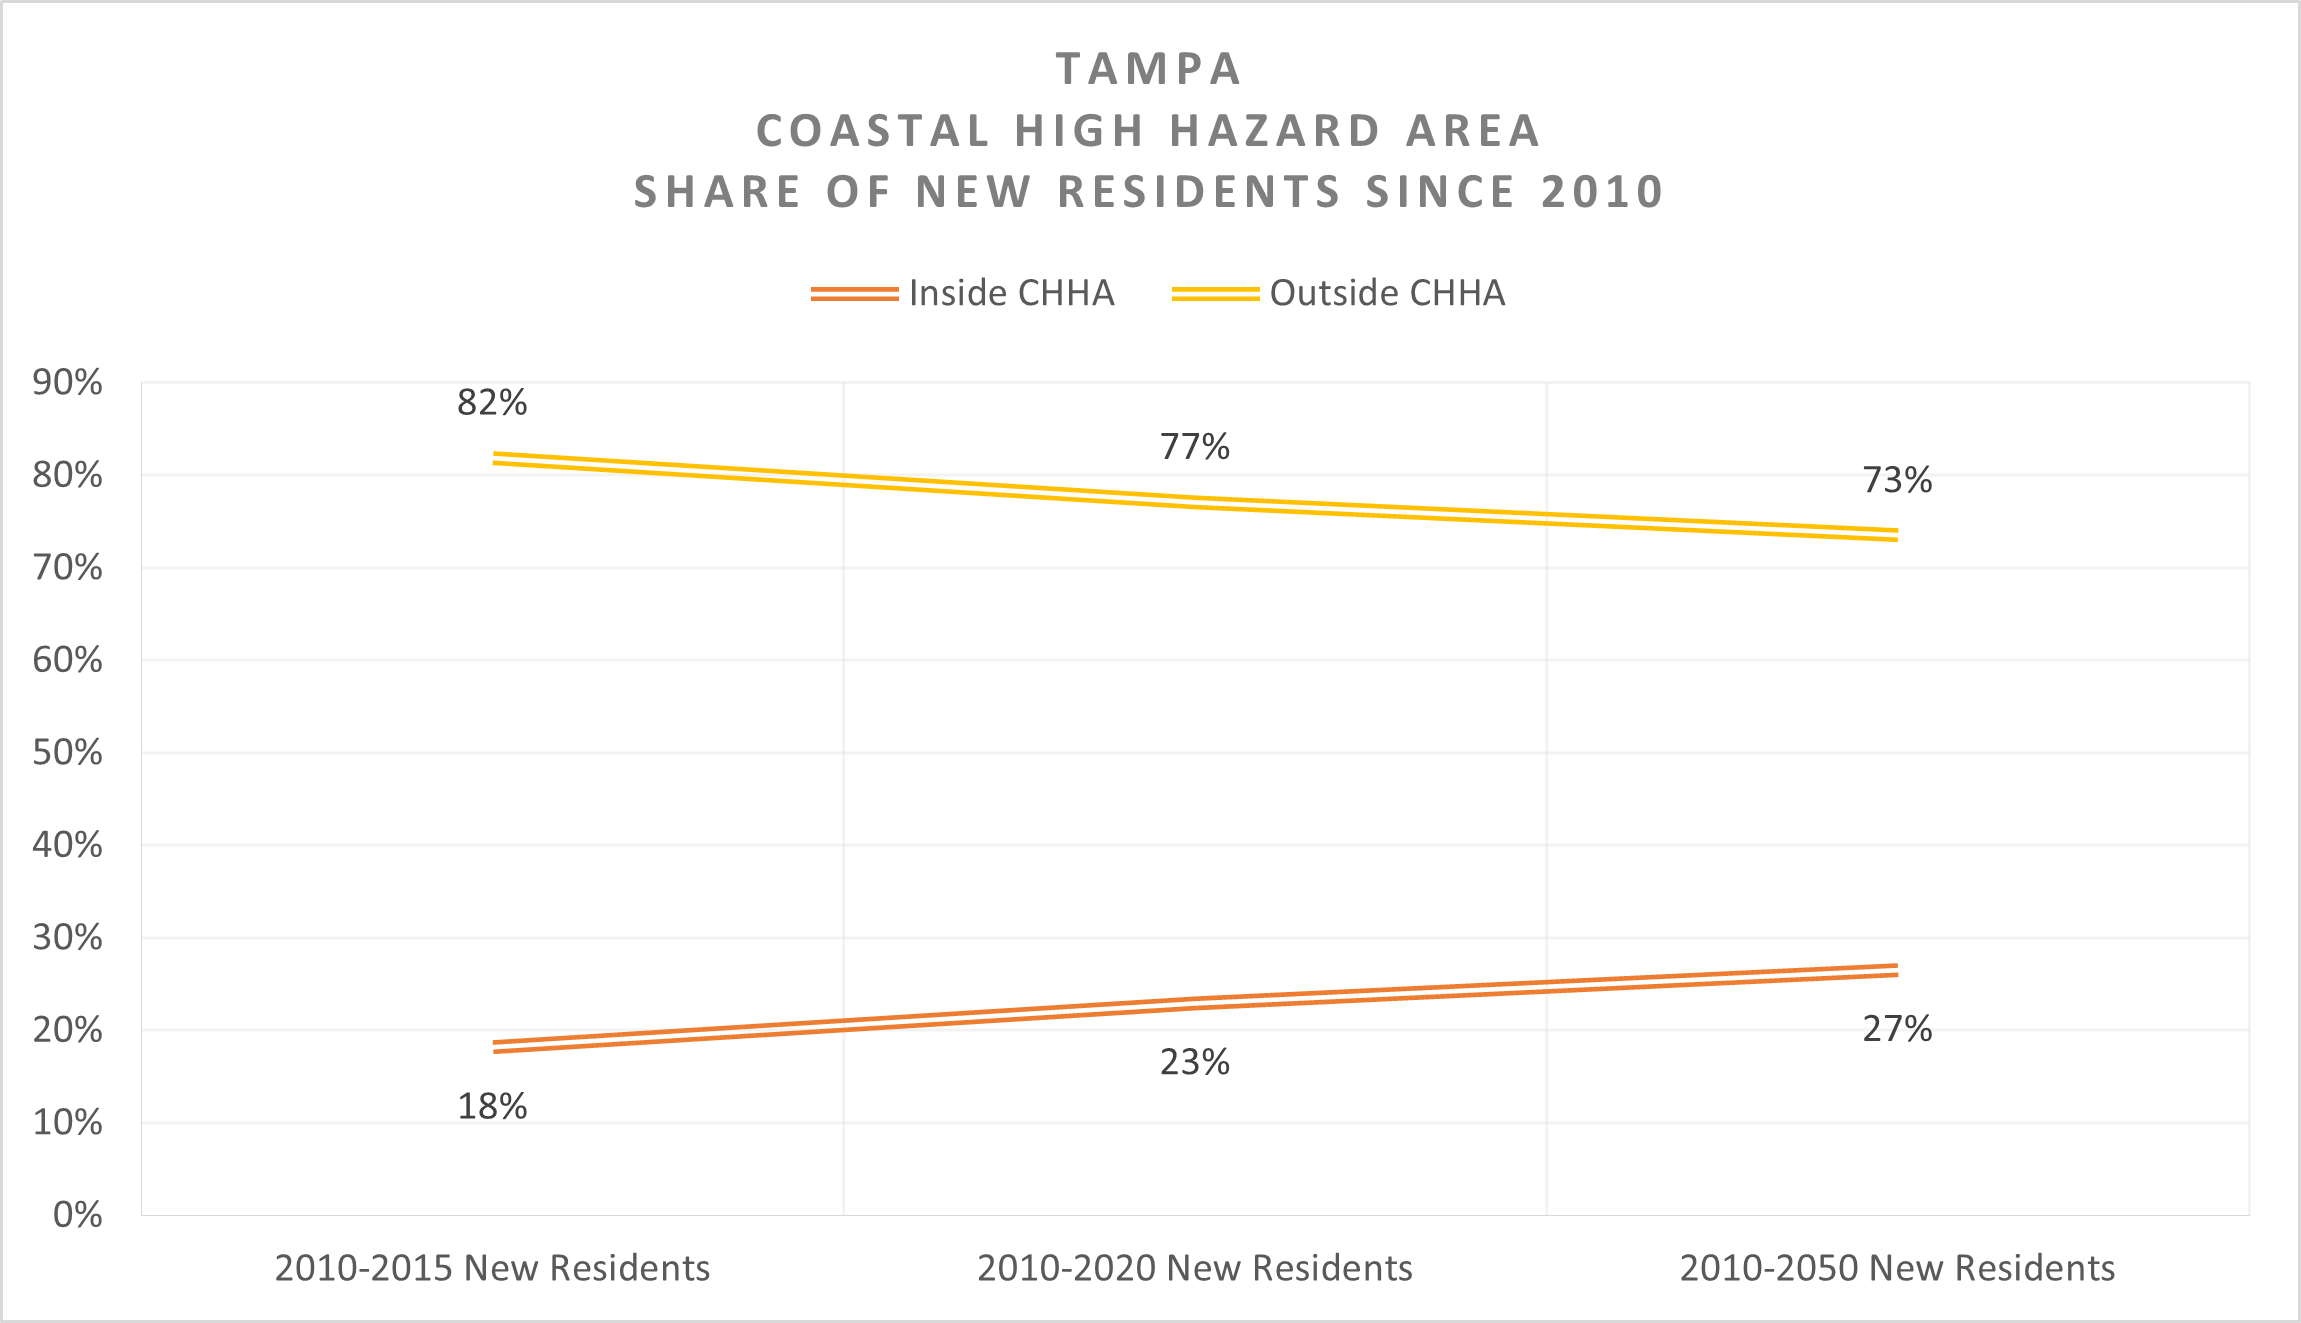
Figure 3g. Central and South Tampa – New Population per Acre Through 2050
EMPLOYMENT GROWTH IN THE CHHA
In Tampa, from 2010 to 2020, employment inside the CHHA grew to 127,639 jobs (43,303 new jobs and 51% higher than 2010). Currently, 28% of the city’s employment is located inside the CHHA. Simultaneously, from 2010 to 2020, the city’s employment outside the CHHA grew to 323,272 jobs (72,245 new jobs or 29% higher than 2010). By 2050, we expect the city’s employment inside the CHHA to reach 163,402 jobs (35,763 new jobs or 28% higher than the 2020 employment). By 2050, the share of the city’s employment inside the CHHA is expected to decrease slightly to 25%. From 2010 through 2020, the areas of the South Tampa and Westshore TIA Planning Districts inside the CHHA attracted the largest number of new jobs moving to CHHA inside Tampa (53% and 27% of all new jobs to the CHHA in Tampa, respectively). From 2020 through 2050, the areas in the Central Tampa and South Tampa Planning Districts inside the CHHA are expected to attract the largest number of new jobs moving to the CHHA inside Tampa (52% and 34% of all expected new jobs to the CHHA in Tampa, respectively). Meanwhile, the city’s employment 2020-2050 percent growth outside the CHHA would be significantly higher. By 2050, the city’s employment outside the CHHA is expected to reach 488,615 jobs (164,843 new jobs or 51% higher than the 2020 employment). See Table 5 and Figures 3a-3g.
Table 2. Tampa – Employment Estimates and Projections Inside and Outside the CHHA
| Tampa Planning Districts in CHHA | 2010 | 2015 | 2020 | 2050 | 2010-2020 New Employment | 2010-2020 Percent Change | 2020-2050 New Employment | 2020-2050 Percent Change |
| Central Tampa | 30,696 | 33,834 | 39,214 | 57,876 | 8,518 | 28% | 18,662 | 48% |
| South Tampa | 23,647 | 33,356 | 46,787 | 58,772 | 23,141 | 98% | 11,984 | 26% |
| USF Institutional | 146 | 165 | 175 | 427 | 29 | 20% | 252 | 144% |
| Westshore TIA | 29,847 | 34,440 | 41,463 | 46,327 | 11,615 | 39% | 4,865 | 12% |
| Tampa CHHA Total | 84,336 | 101,795 | 127,639 | 163,402 | 43,303 | 51% | 35,763 | 28% |
| Inside CHHA | 84,336 | 101,795 | 127,639 | 163,402 | 43,303 | 51% | 35,763 | 28% |
| Outside CHHA | 251,527 | 292,988 | 323,772 | 488,615 | 72,245 | 29% | 164,843 | 51% |
| Tampa Total | 335,863 | 394,783 | 451,411 | 652,017 | 115,548 | 34% | 200,606 | 44% |
Figure 3a. Tampa – Employment inside and outside Coastal High Hazard Area
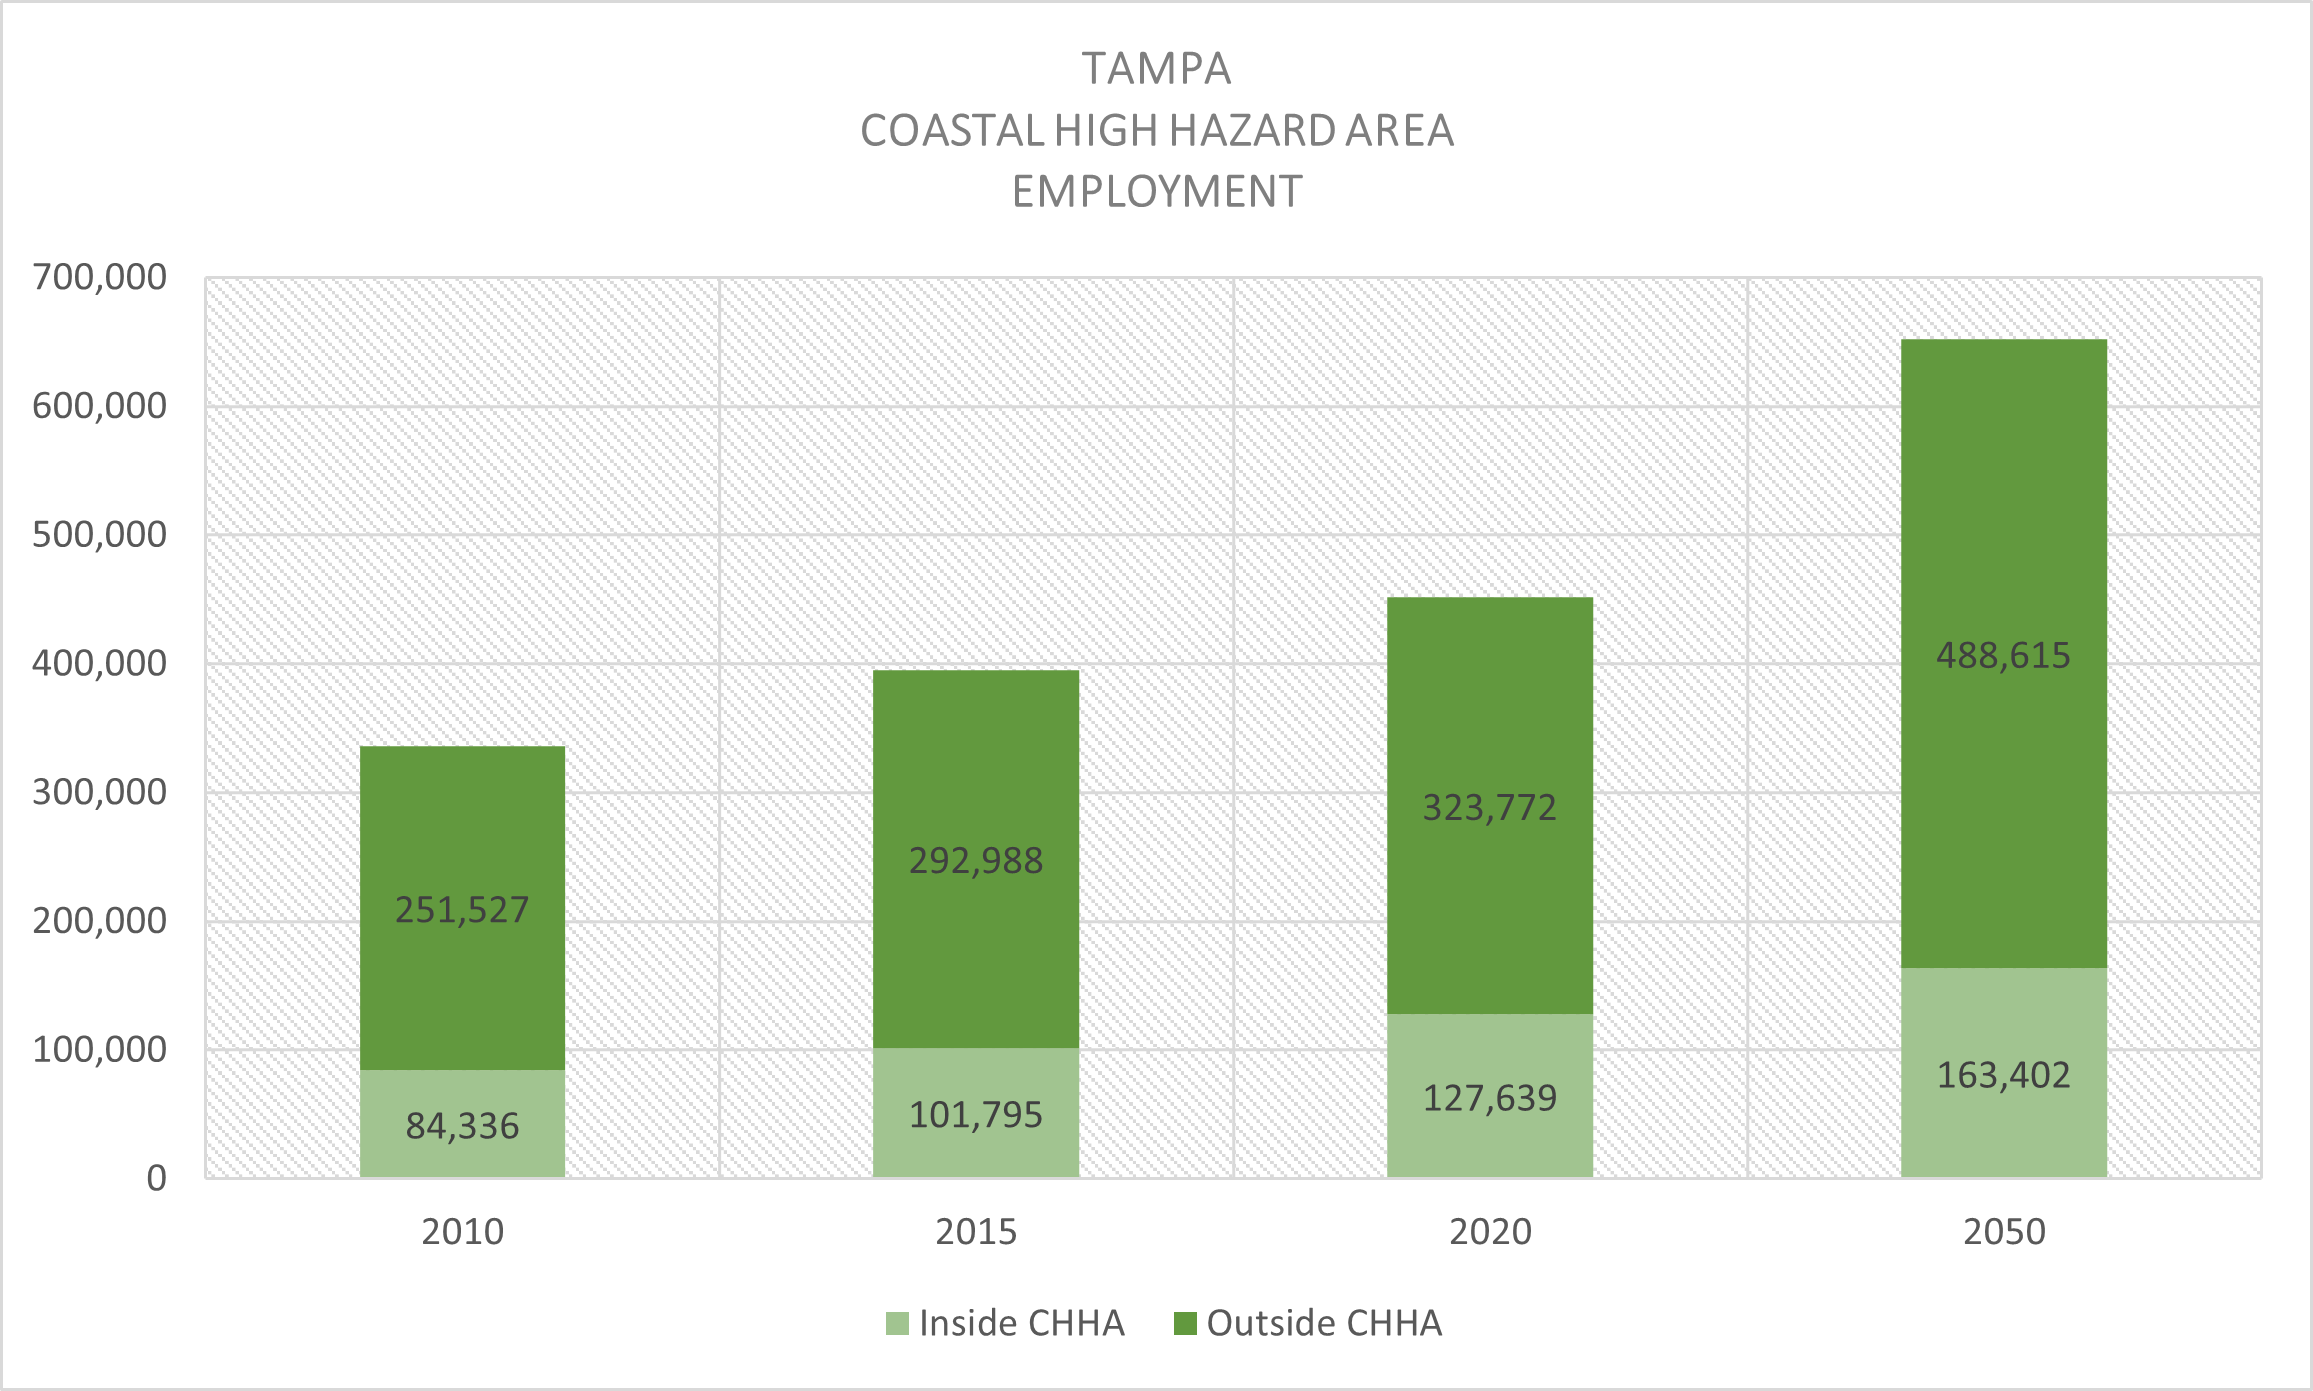
Figure 3b. Tampa – Share of Employment inside and outside Coastal High Hazard Area
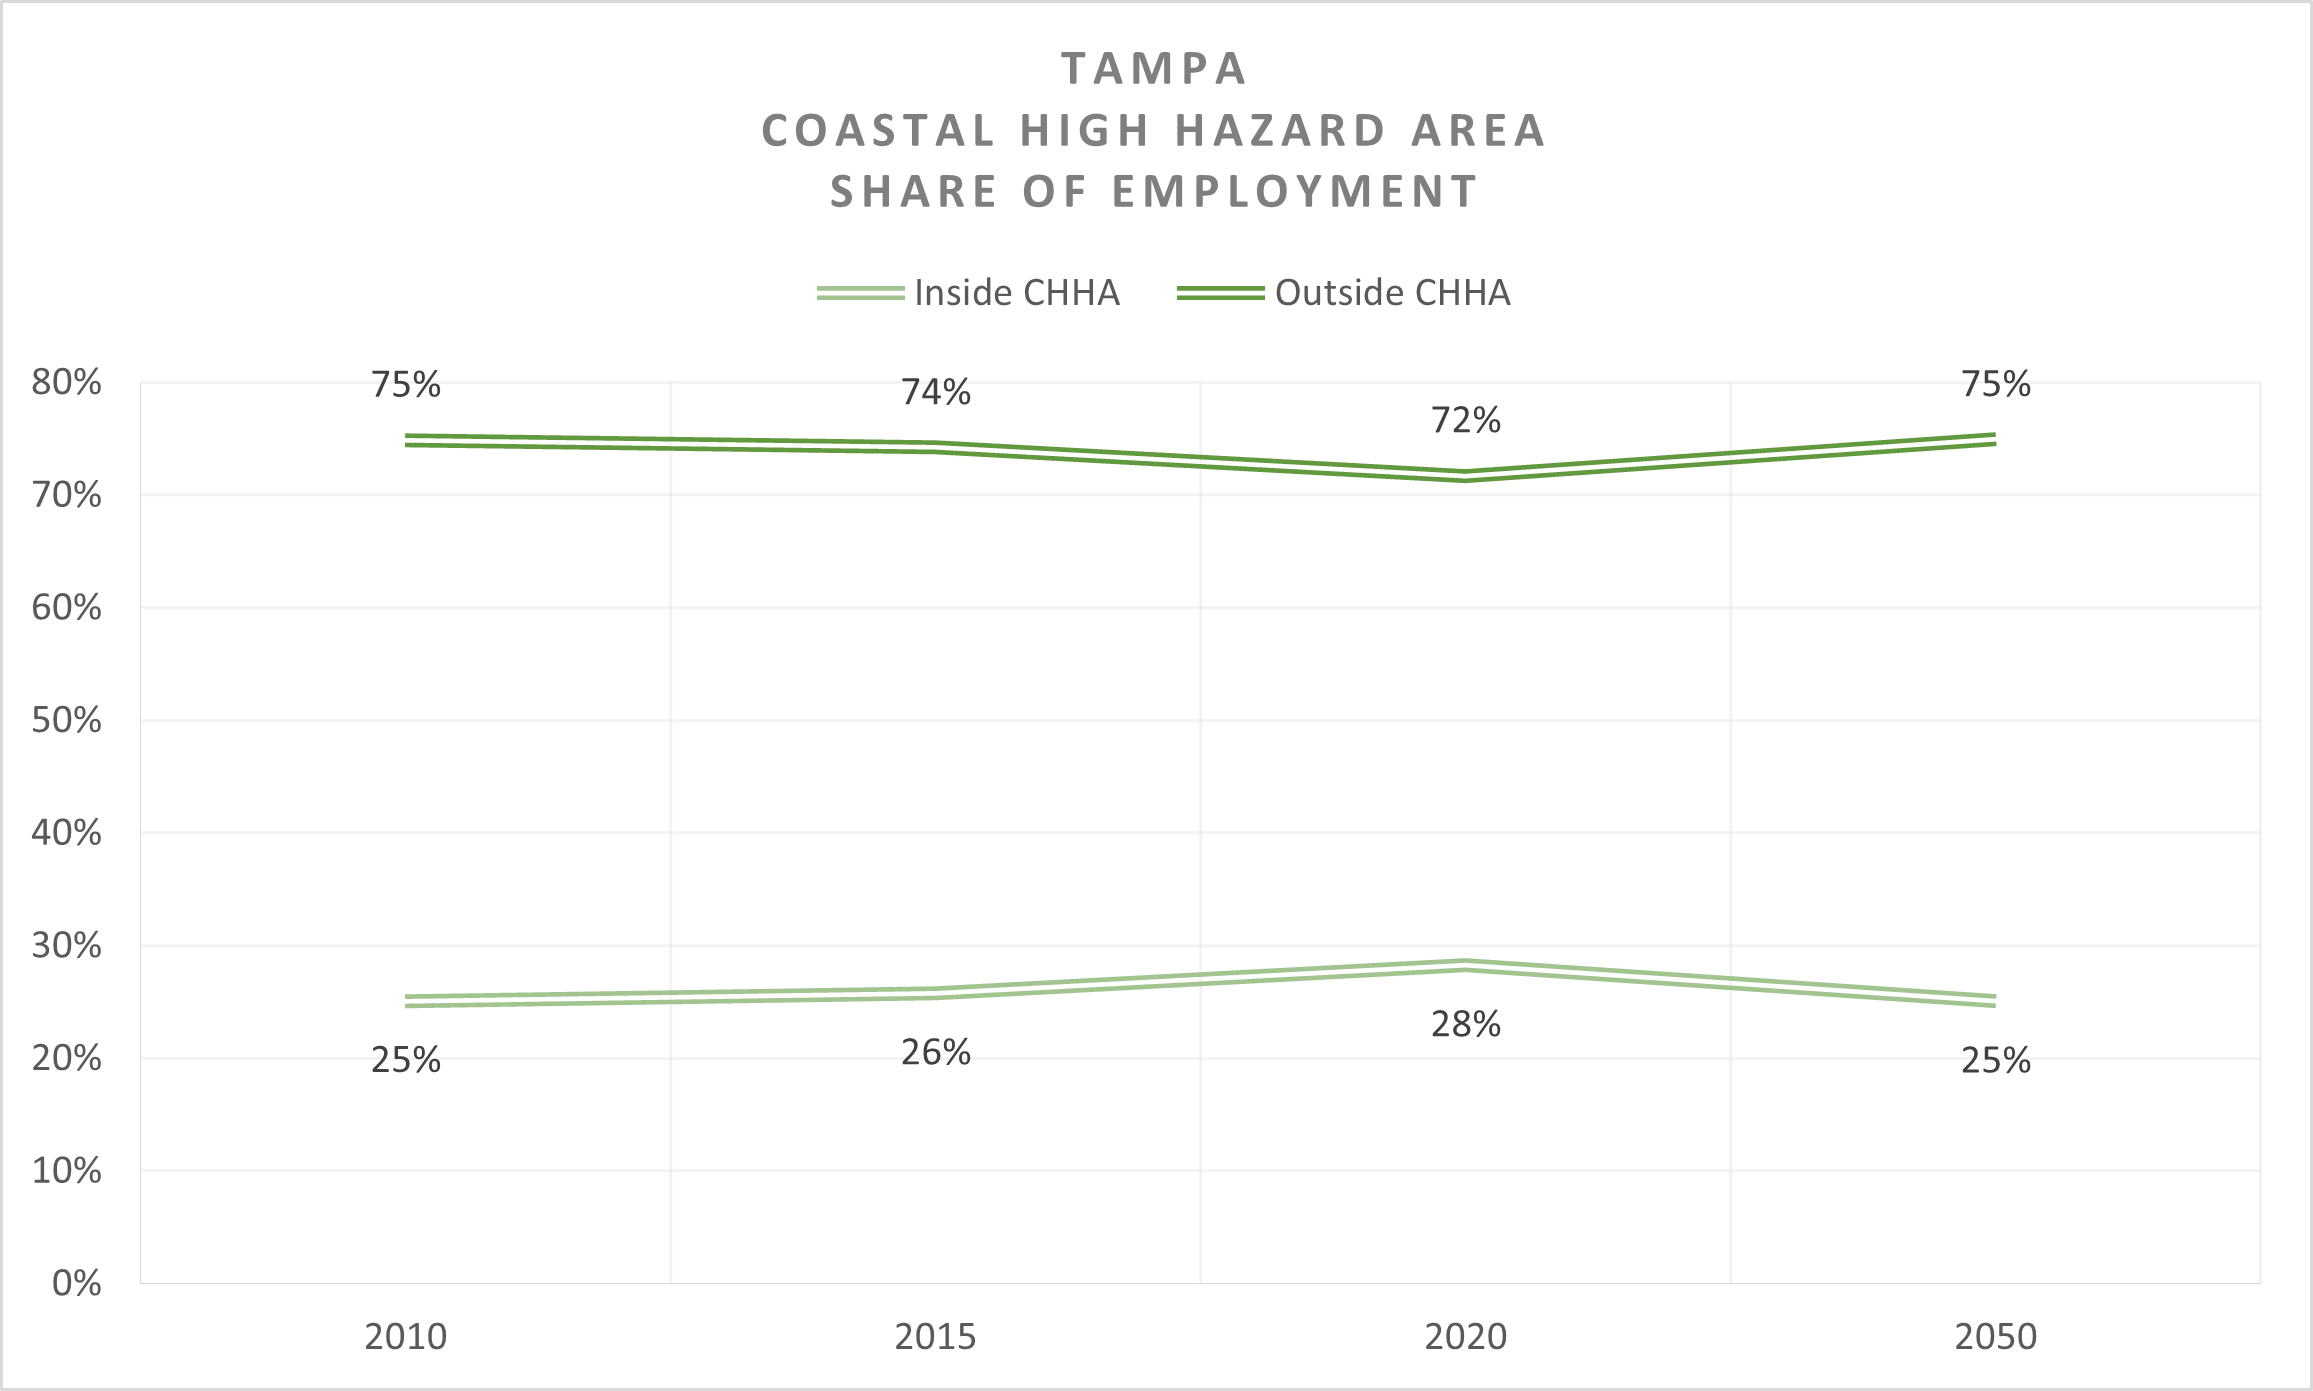
Figure 3c. Tampa – New Employment inside and outside Coastal High Hazard Area
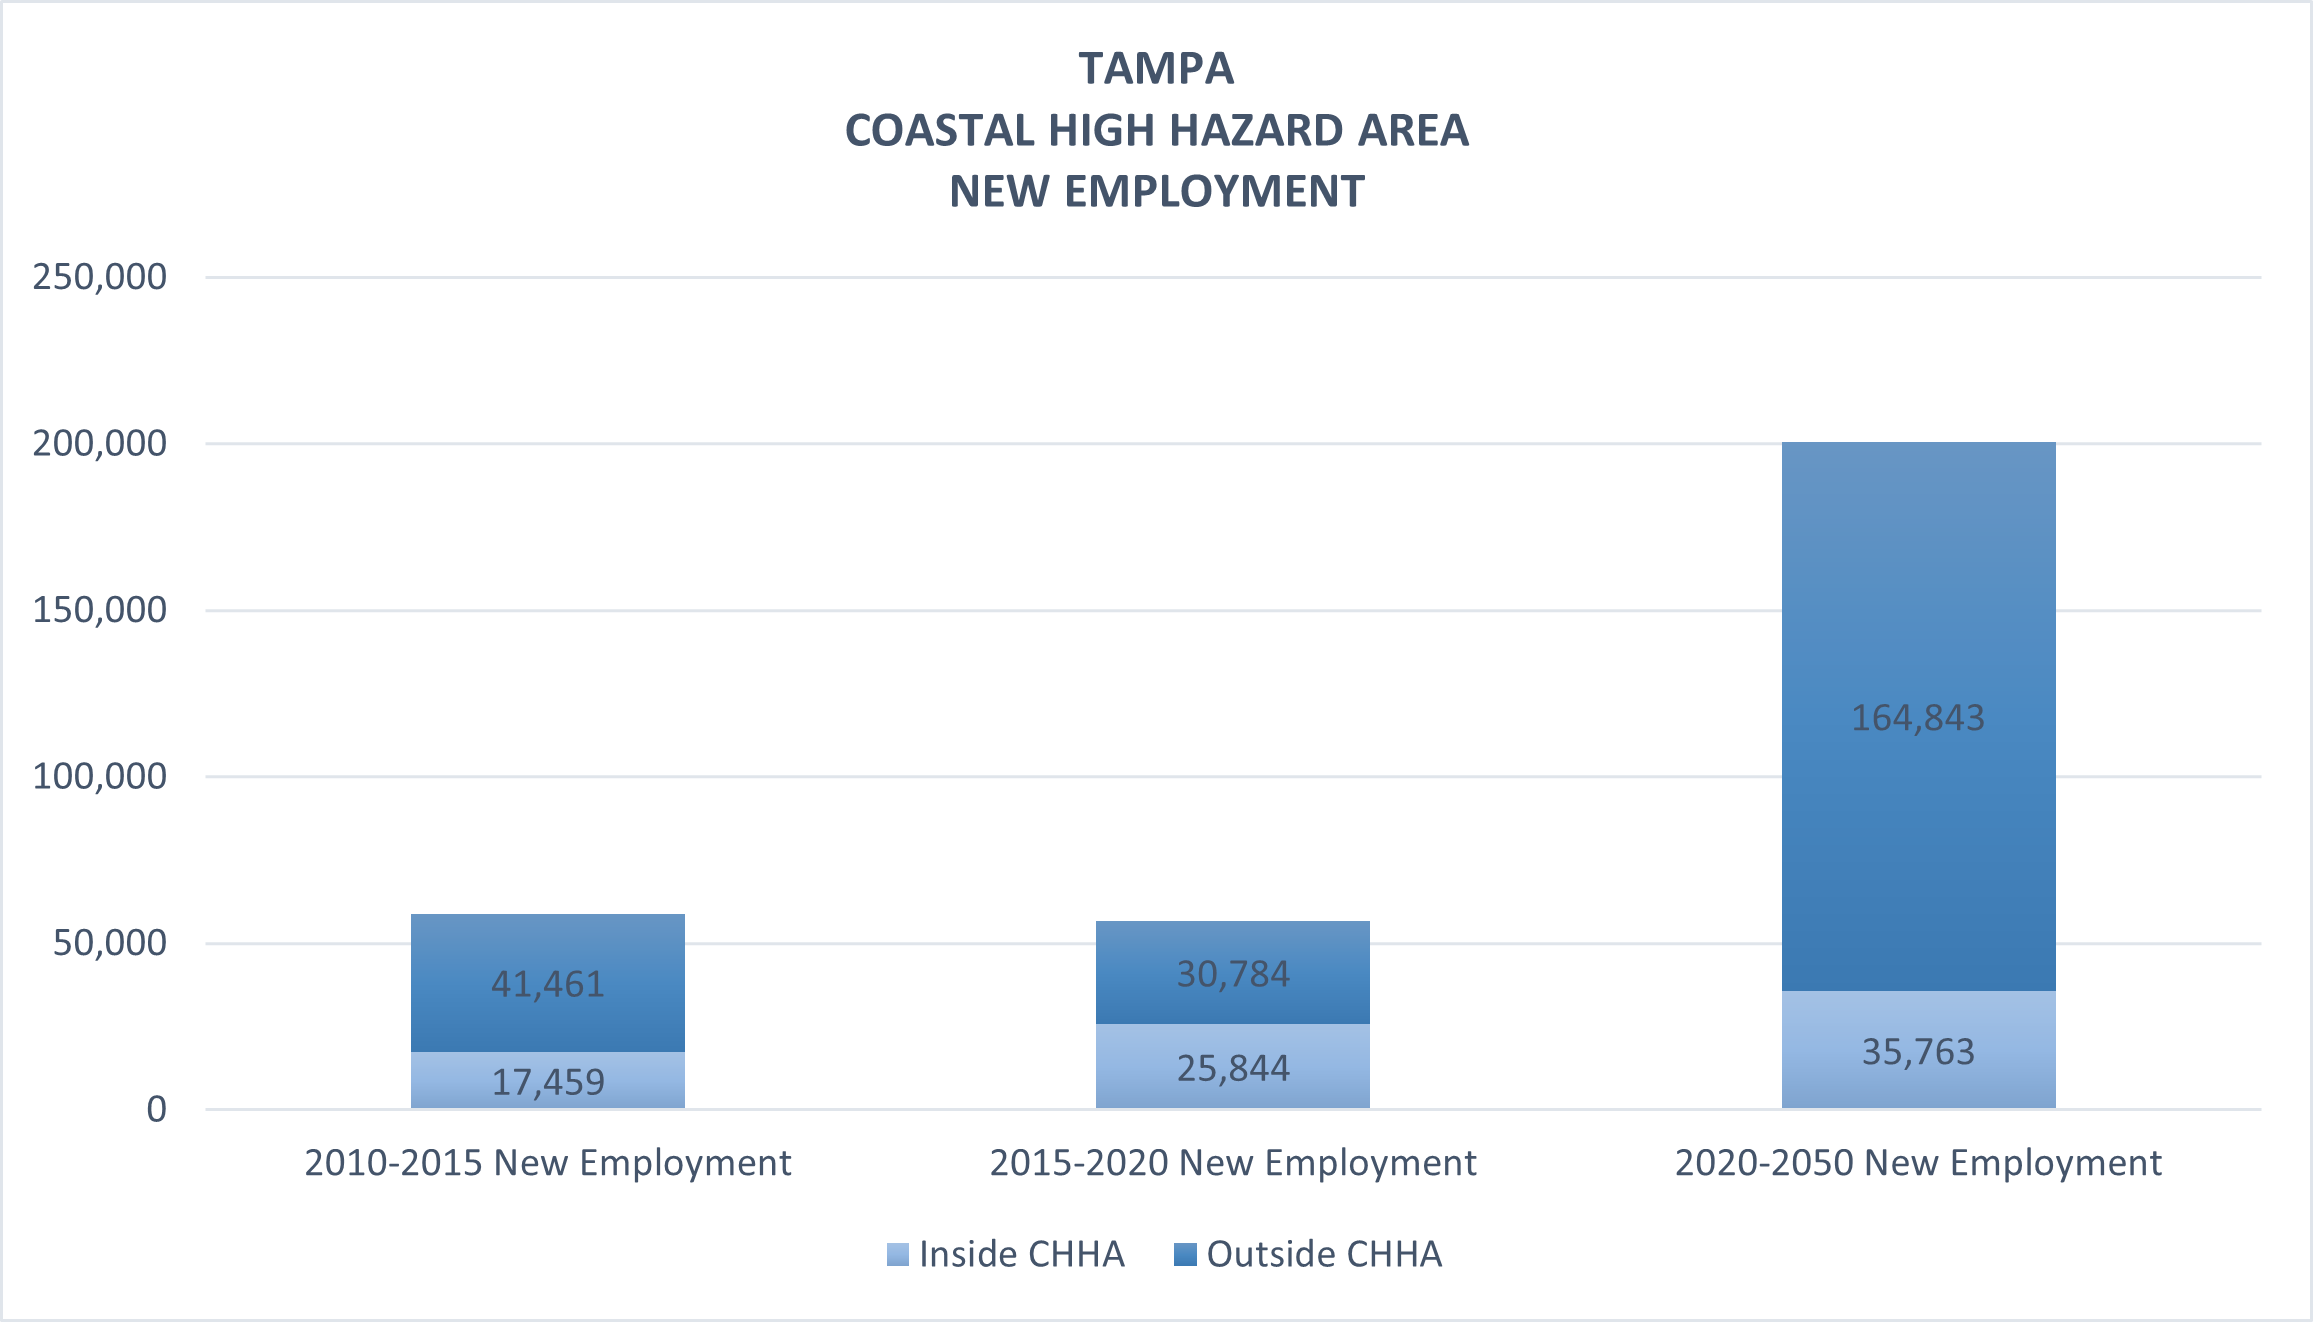
Figure 3d. Tampa – Share of New Employment inside and outside Coastal High Hazard Area
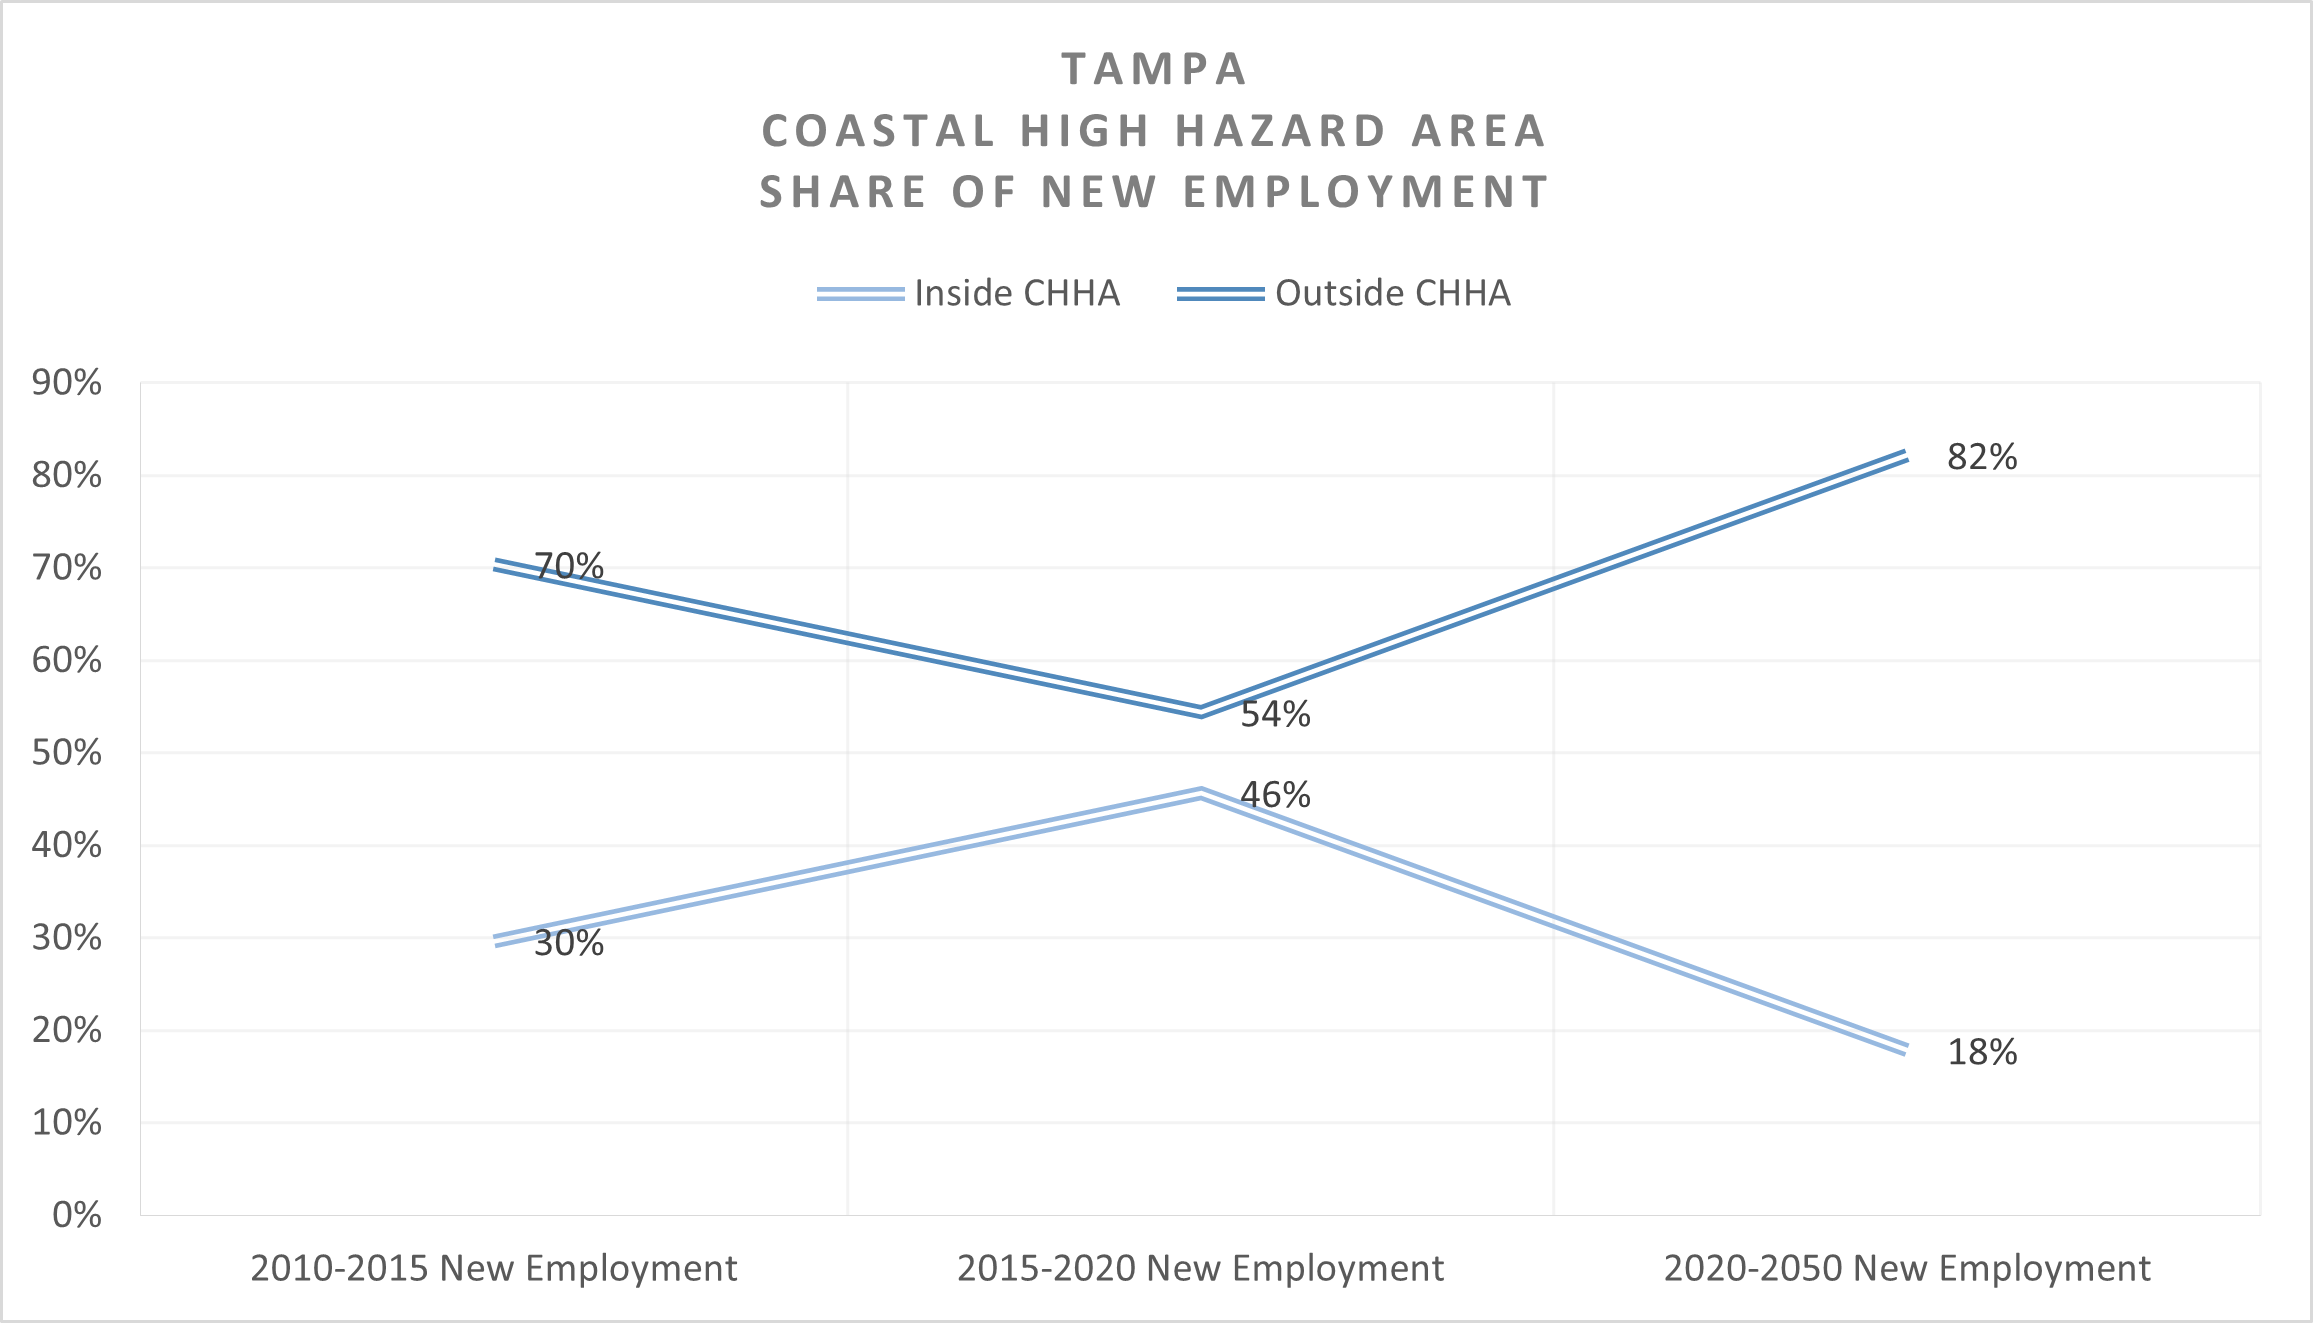
Figure 3e. Tampa – New Employment since 2010 inside and outside Coastal High Hazard Area
Figure 3f. Tampa – Share of New Employment since 2010 inside and outside Coastal High Hazard Area
Figure 3g. Central and South Tampa – New Employment per Acre Through 2050
Conclusion
To conclude, we presented population and employment projections within the Coastal High Hazard Area based on densities and intensities publicly discussed and adopted Future Land Use categories well before these projections were developed. Within Tampa, 66,986 persons currently reside within the CHHA. In effect, nearly 1 in 5 Tampeños live inside the CHHA. By 2050, 95,645 Tampeños will reside within the CHHA (43% higher than 2020). Most new Tampeños within the CHHA will reside in Central Tampa and South Tampa. Meanwhile, there are 127,639 jobs within the CHHA. They represent 28% of 2020 jobs in Tampa. By 2050, we are projecting 163,402 jobs within the CHHA (28% higher than 2020). As suggested earlier, the increases in population and jobs we are seeing in the CHHA are largely due to the building out of areas that were previously planned for those populations and jobs. Lastly, City and Planning Commission staff are currently holding public meetings on policy language that may affect potential density and intensity increases inside CHHA areas via comprehensive plan amendments.
[ii] “The Coastal High Hazard Area is an area particularly vulnerable to the effects of coastal flooding from tropical storm events and is defined by section 163.3178(2)(h)9, Florida Statutes, as the area below the elevation of the category 1 storm surge line as established by a Sea, Lake, and Overland Surges from Hurricanes (SLOSH) computerized storm surge model.” Source: https://www.floridajobs.org/community-planning-and-development/programs/community-planning-table-of-contents/coastal-high-hazard-areas#:~:text=The%20Coastal%20High%20Hazard%20Area,and%20Overland%20Surges%20from%20Hurricanes