


Published
January 2, 2024
Contact
Yassert A. Gonzalez
Manager – Economics, Demographics & Research
813-582-7356 (o)
[email protected]
planhillsborough.org
Last updated
February 21, 2024
Every five years, staff conducts a collaborative exercise which results in new long-range population forecasts [1]. The final draft and all supporting documentation are found here: 2050 Long Range Growth Forecasts. For several months now, we have been publishing blogs on 2050 projections for small areas. This is the seventh blog in this series. See previous blogs discussing other areas inside Hillsborough County here. This month we are reviewing 2050 projections for the Urban Service Area.
As seen in Figures 1 and 2, the Urban Service Area comprises City of Plant City, City of Tampa (includes areas outside the jurisdiction and served water/sewer by City of Tampa), City of Temple Terrace, and Northwest/South Central Hillsborough Utility Service Areas. The Urban Service Area is a planning tool to prevent sprawl and ensure a diversity of housing styles and communities in the county.
Figure 1. Developable and Redevelopable Parcels in the Urban Service Area
Figure 2. Developable and Redevelopable Parcels in the Urban Service Area by Future Land Use Type
From 2010 to 2020, the Urban Service Area’s population grew 21% to 1,360,879 residents. Meanwhile, the Rural Service Area’s population grew 14% to 117,880 residents. The Urban Service Area captured 94% of the 2010-2020 growth in population.
By 2050, the Urban Service Area’s population is expected to reach 1,752,045 people (391,167 new residents or 29% higher than 2020 population). In the Rural Service Area, the population is projected to more than double and reach 265,249 residents (147,368 new residents or 125% higher than 2020) (See Table 1 and Figure 3). As seen in Figure 4, the highest new residents per acre are expected to be within or adjacent to Plant City, Tampa, Temple Terrace, and the Urban Service Area.
Table 1. Population Estimates and Projections by Urban Service Area and Rural Service Area in Hillsborough County
| Utility Service Areas | 2010 | 2020 | 2010-2020 New Population | 2010-2020 Percent Change | Share of 2010-2020 Growth | 2050 | 2020-2050 New Population | 2020-2050 Percent Change | Share of 2020-2050 Growth |
| Rural Service Area | 103,045 | 117,880 | 14,836 | 14% | 6% | 265,249 | 147,368 | 125% | 27% |
| Urban Service Area (Northwest Hillsborough USA, Plant City, South Central Hillsborough USA, Tampa Service Area) | 1,126,181 | 1,360,879 | 234,697 | 21% | 94% | 1,752,045 | 391,167 | 29% | 73% |
| Total | 1,229,226 | 1,478,759 | 249,533 | 35% | 100% | 2,017,294 | 538,535 | 36% | 100% |
Figure 3. 2010 and 2020 Population Estimates and 2050 Planning Population Projection by Utility Service Area
Figure 4. New Jobs per Acre Through 2050 inside and outside the Urban Service Area
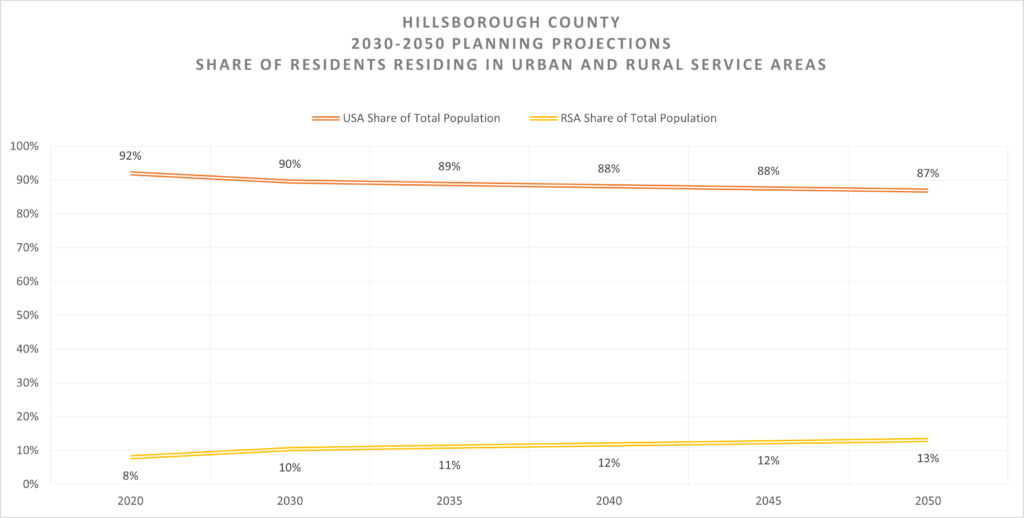
One of the objectives of the Comprehensive Plan is to direct 80% of the new growth towards the Urban Service Area[i]. As seen on Figure 5, the share of new residents expected to move to the Urban Service Area will decrease slightly from 76% in 2030 to 73% in 2050. Alternatively, by 2050, 87% of the county residents will reside within the Urban Service Area (See Figure 6).
Figure 5. Share of New Residents Moving to the Urban and Rural Service Areas
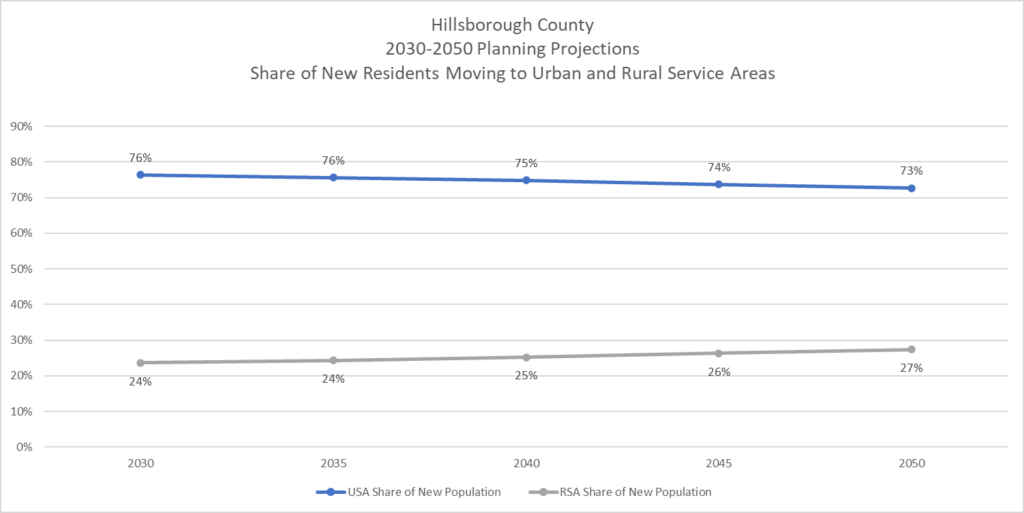
Figure 6. Share of Residents Residing in the Urban and Rural Service Areas
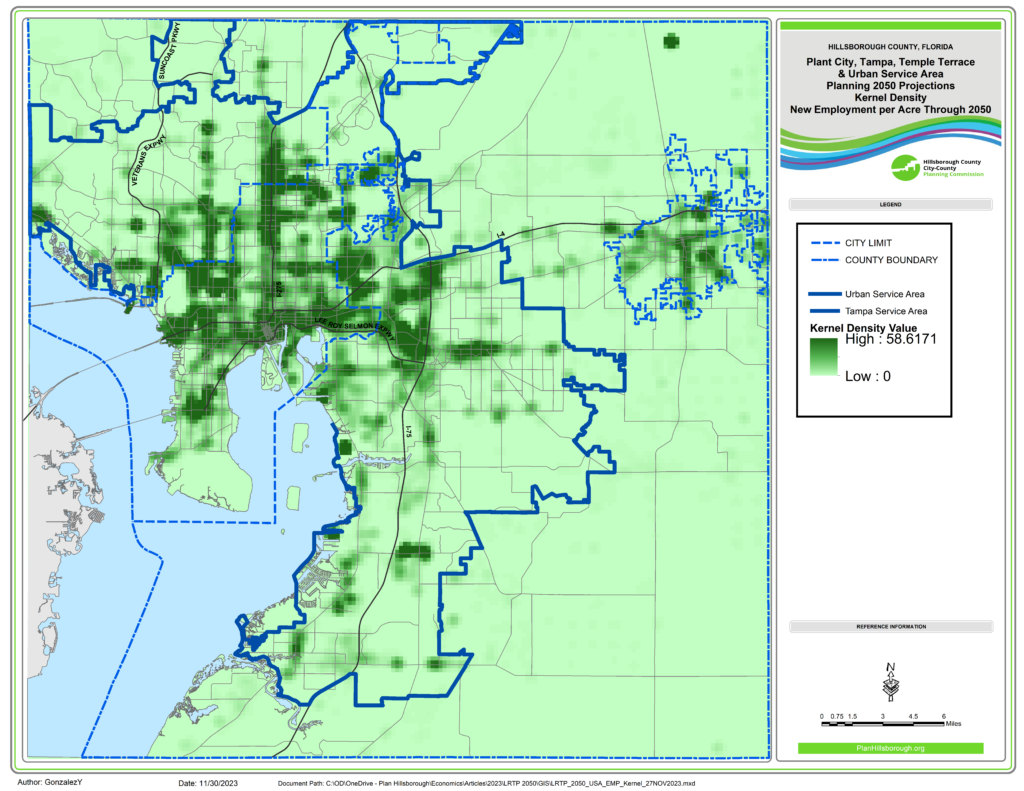
In terms of employment, from 2010 to 2020, Urban Service Area’s employment grew 35% to 930,710 jobs (See Table 2 below). Moreover, employment in the Rural Service Area grew 12% to 28,677. By 2050, the Urban Service Area’s employment is expected to reach 1,344,831 jobs (414,831 new jobs or 44% higher than 2020 jobs). Also, by 2050, employment in the Rural Service Area is expected to reach 47,470 jobs (18,792 new jobs or 66% higher than 2020) (See Table 2 and Figure 7). As seen in Figure 8, the highest new jobs per acre are expected to be within or adjacent to Plant City, Tampa, Temple Terrace, and the Urban Service Area.
Table 2. Employment Estimates and Projections by Urban and Rural Service Area in Hillsborough County
| Utility Service Areas | 2010 | 2020 | 2010-2020 New Employment | 2010-2020 Percent Change | 2010-2020 Share of Growth | 2050 | 2020-2050 New Employment | 2020-2050 Percent Change | 2020-2050 Share of Growth |
| Rural Service Area | 25,518 | 28,677 | 3,160 | 12% | 1% | 47,470 | 18,792 | 66% | 4% |
| Urban Service Area (Northwest Hillsborough USA, Plant City, South Central Hillsborough USA, Tampa Service Area) | 691,686 | 930,710 | 239,023 | 35% | 99% | 1,344,831 | 414,121 | 44% | 96% |
| Total | 717,204 | 959,387 | 242,183 | 47% | 100% | 1,392,301 | 432,914 | 45% | 100% |
Figure 7. 2010 and 2020 Employment Estimates and 2050 Planning Employment Projection by Utility Service Area
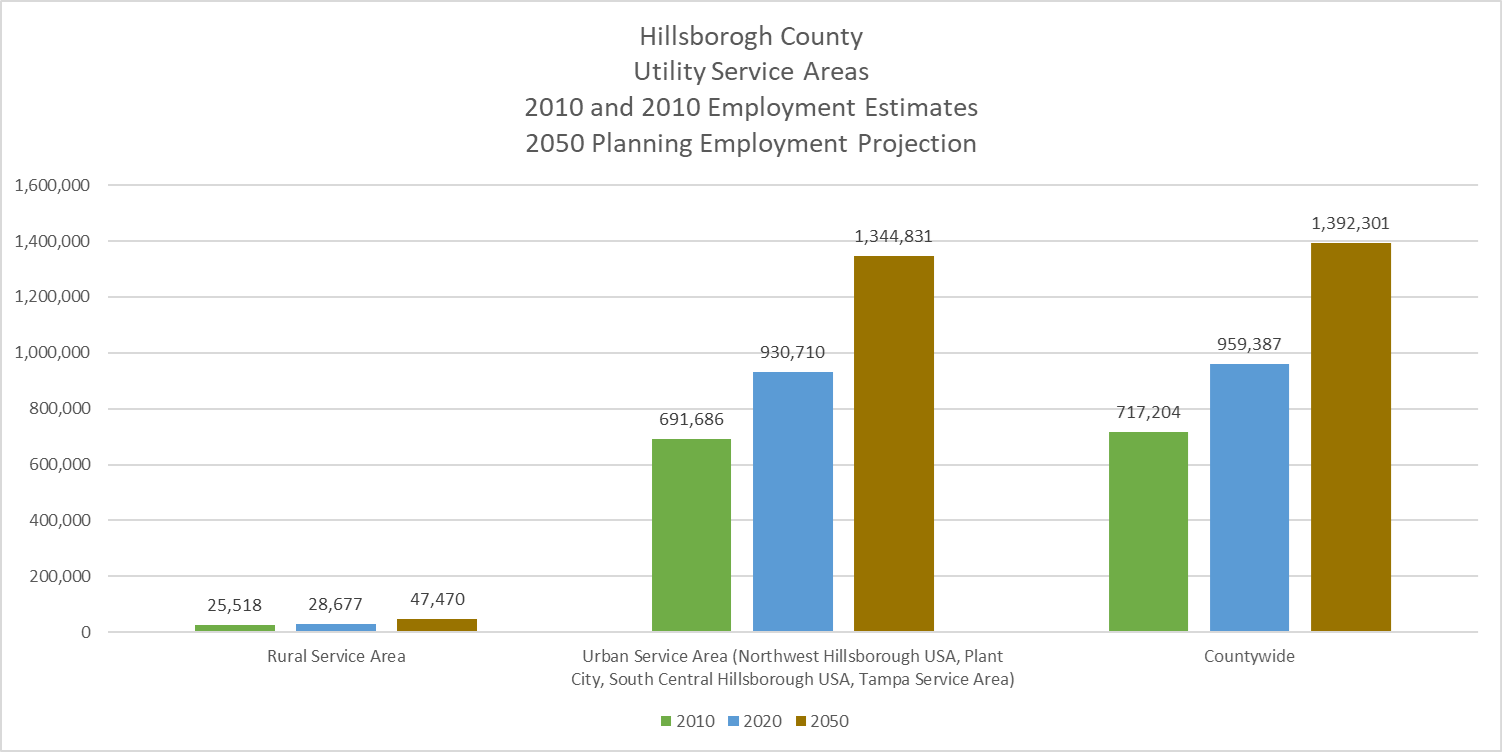
Figure 8. New Jobs per Acre Through 2050 inside and outside the Urban Service Area
To conclude, by 2050, we expect population in the Urban Service Area to grow to 1,752,045 persons (391,167 new persons and 29% higher than 2020). Nearly 3 out of 4 new residents are expected to move to the Urban Service Area. Jobs in the Urban Service Area are expected to reach 1,344,831 through 2050 (414,121 new jobs or 44% higher than 2020). For more information: 2050 Long Range Growth Forecasts.
[1] The initial draft was based BEBR’s projections published in 2022. Link: https://www.bebr.ufl.edu/wp-content/uploads/2022/02/projections_2022.pdf
[i] Objective 1: Hillsborough County shall pro-actively direct new growth into the urban service area with the goal that at least 80% of all population growth will occur within the USA during the planning horizon of this Plan. Within the Urban Service Area, Hillsborough County will not impede agriculture. Building permit activity and other similar measures will be used to evaluate this objective.