


Published
February 6, 2023
Contact
Yassert A. Gonzalez | Manager – Economics, Demographics & Research | 813-582-7356 (o) | [email protected] | planhillsborough.org
Last updated
July 17, 2023
As we discussed in the last article, Hillsborough County’s population continues to grow albeit a relatively slower rate than before 2020. Typically for Florida, most of the growth is from new households moving to the county from other counties in Florida or other areas. In this article, we use IRS Statistics of Income data[i] to examine inflows of new households and reported Adjusted Gross Income (AGI) moving to Hillsborough County.
As shown by the tables, charts, and maps, below, Hillsborough County is one of the top destinations for new households (and their AGI) moving to Florida. As a moving destination, Hillsborough County appears to be slightly more popular with folks residing outside Florida than other Floridians. Moreover, the annual average of new households and new AGI has increased since 2017. Lastly, nearly half of the households moving to Hillsborough County come from other counties in the Tampa Bay Region or Central Florida.
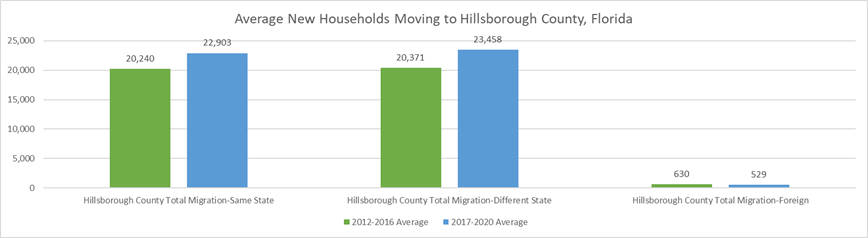
As seen in Chart 1, annually 46,890 households move to Hillsborough County[ii]. They represent 8% of Hillsborough County households. Since 2012, these new households have ranged from 29,971 (2015) to 53,223 (2017). Hillsborough County attracts slightly more new households outside Florida (~23k households) than from inside Florida (~20K households). Chart 2 shows that Hillsborough County has been attracting more new households since 2017 (13% higher).
Chart 1. New Households Moving to Hillsborough County, Florida
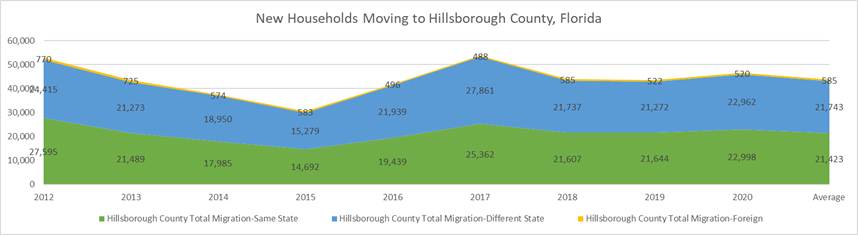
Chart 2. Average New Households Moving to Hillsborough County, Florida
As seen in Chart 3, since 2012, AGI from new households moving to Hillsborough County has ranged from $2 billion (2015) to $4.1 billion (2017)[iii]. The largest inflow arrives with households from other states ($1.76 billion per year). Currently, Hillsborough is attracting a relatively small number of households and AGI from folks residing outside the US ($42 million per year).
Chart 3. Average Annual AGI Inflows to Hillsborough County, Florida
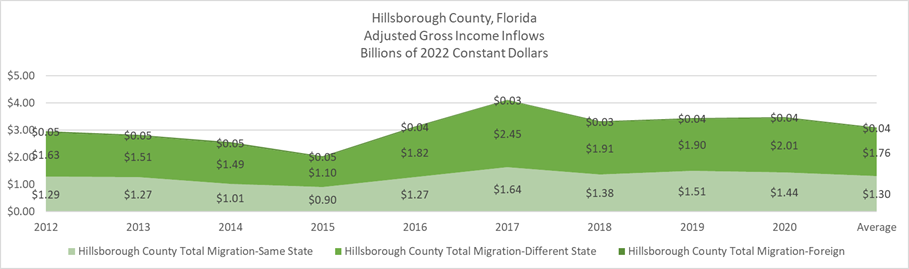
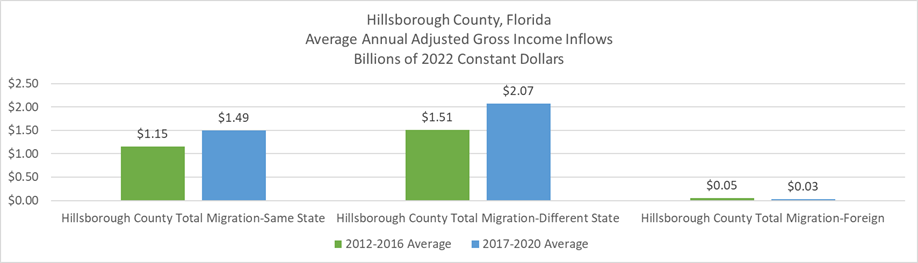
Chart 4 compares AGI inflows from two periods 2012-2016 and 2017-2020. AGI inflows from US households moving to Hillsborough County from other counties on Florida or other states are 29-37% higher than they were in 2012-2016. Alternatively, 2017-2020 average annual AGI inflows from foreigners have decreased 30%. On average, households moving to Hillsborough County bring $3.6 billion per year or $77,000 per household per year.
Chart 4. Average Annual AGI Inflows to Hillsborough County, Florida
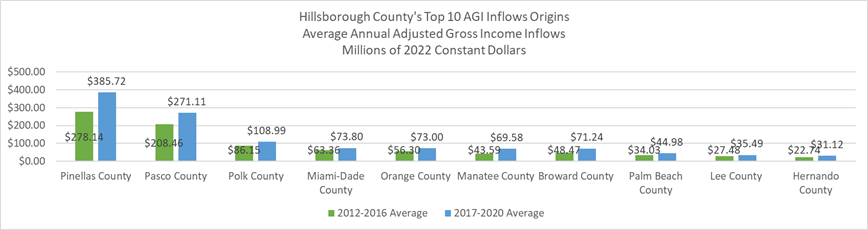
As seen in Chart 5, most new Households (and new AGI) came from nearby Pasco, Pinellas, and Polk Counties. In fact, five of the top ten origins of new households are in the Tampa Bay Region. They range from 514 (Hernando County) to 4,890 (Pinellas County). Similarly, Chart 6 reveals that 5 of the top 10 AGI Inflows also originate from other counties in the Tampa Bay Region. These inflows range from $31 million (Hernando County) to $386 million (Pinellas County).
Chart 5. Hillsborough County’s Top 10 Origin of New Households
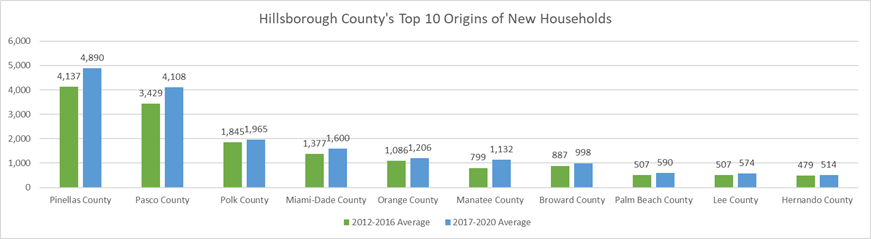
Chart 6. Hillsborough County’s Top 10 AGI Inflows Origins
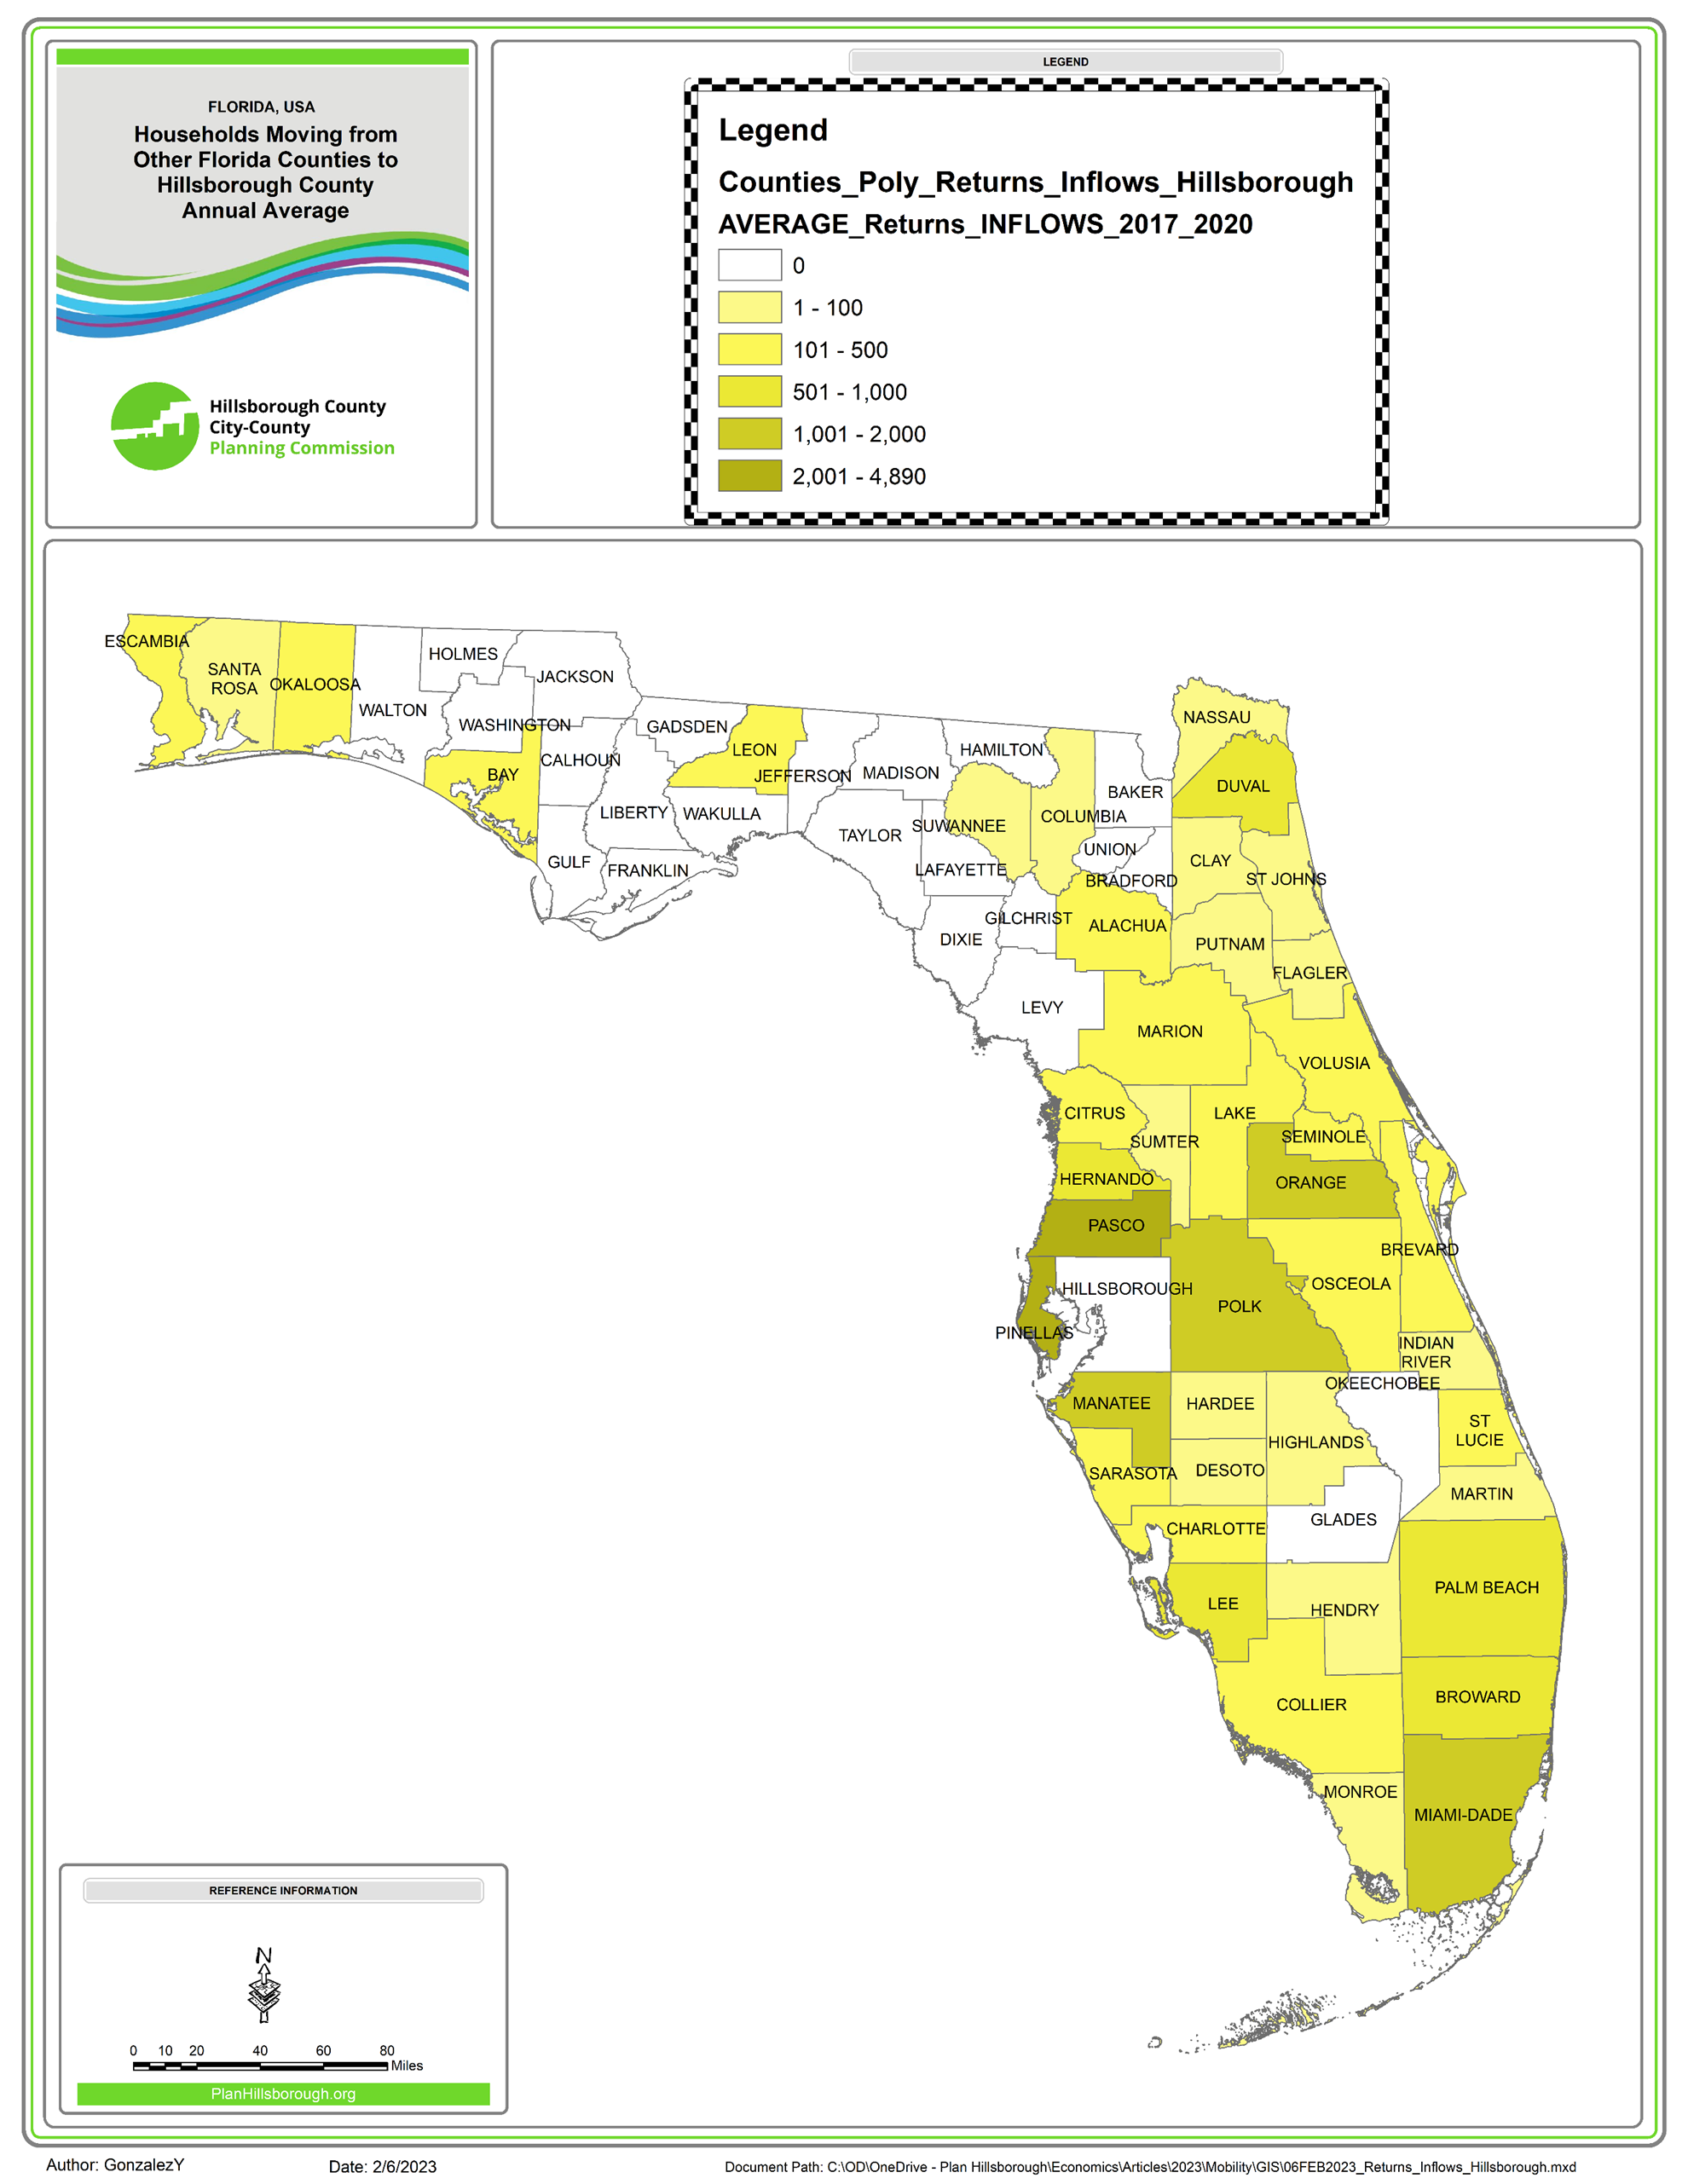
Map 1 shows the counties of origin for new households moving to Hillsborough County. Around 1,600 Miami-Dade households (with $74 million AGI) move to Hillsborough County every year. The Map 2 shows the originating counties for Hillsborough County’s in-state AGI Inflows.
Map 1. Originating Florida Counties of New Households Moving to Hillsborough County
Map 2. Florida Origins of AGI Inflows to Hillsborough County
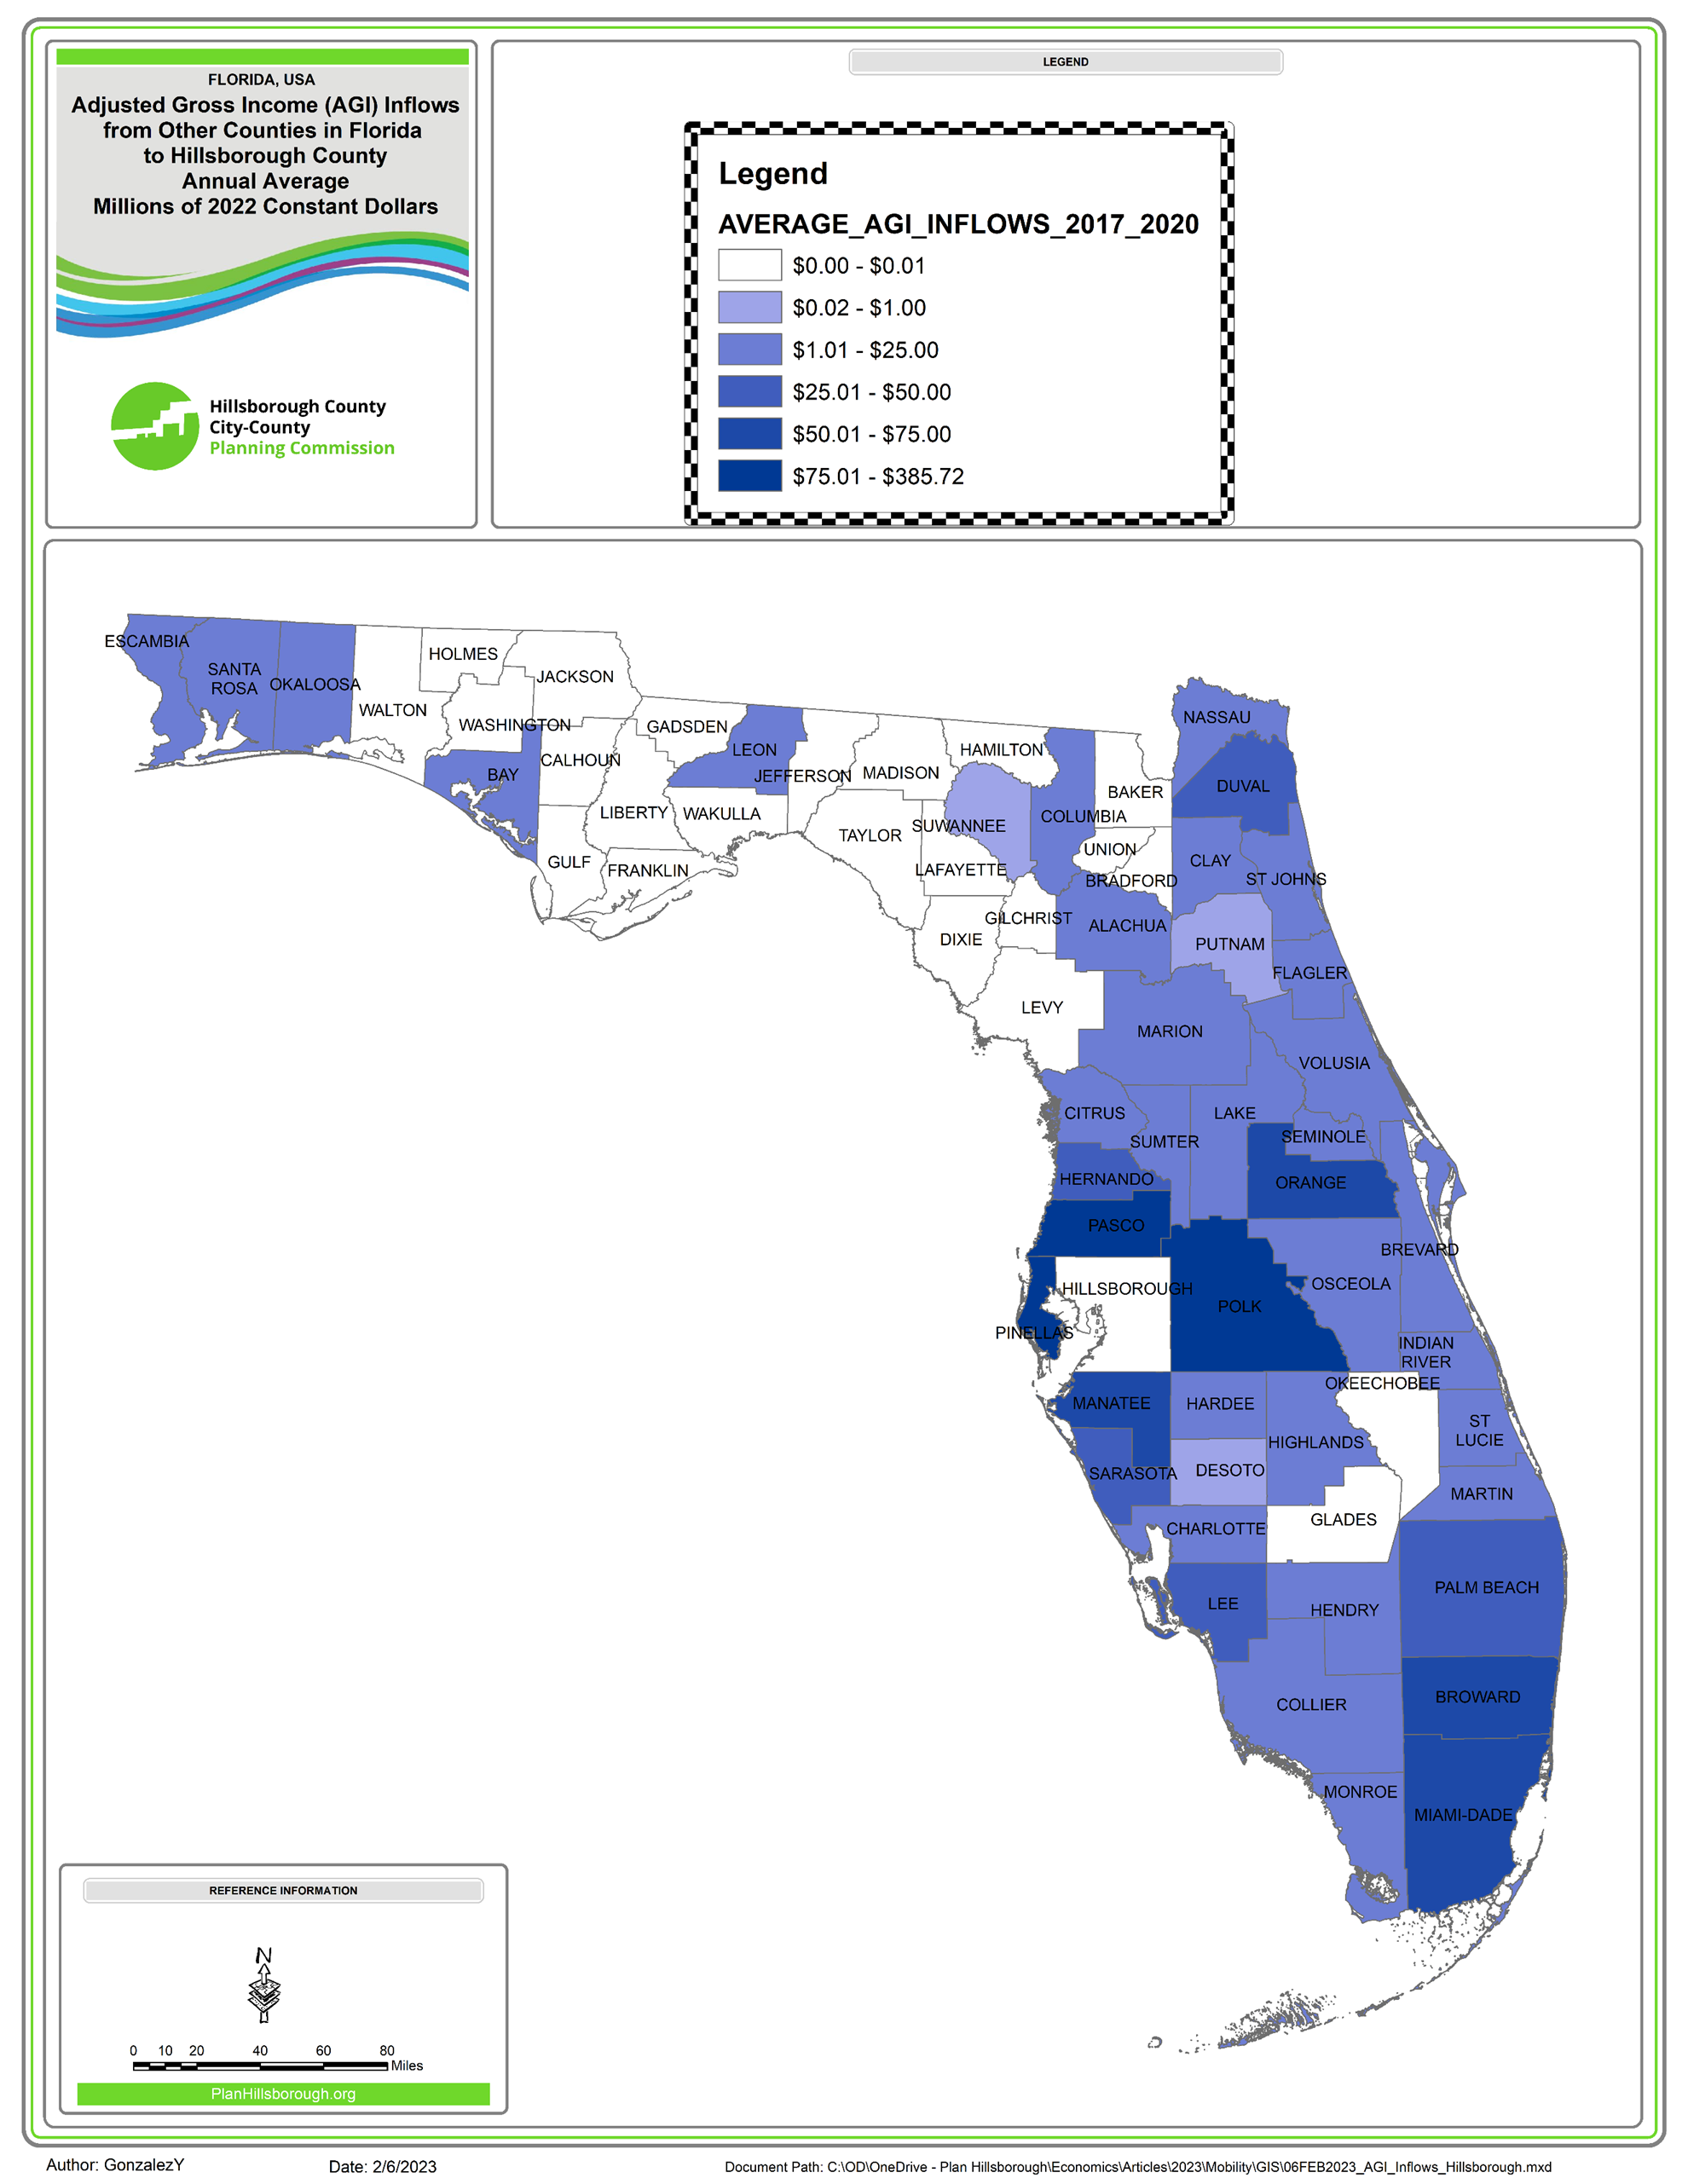
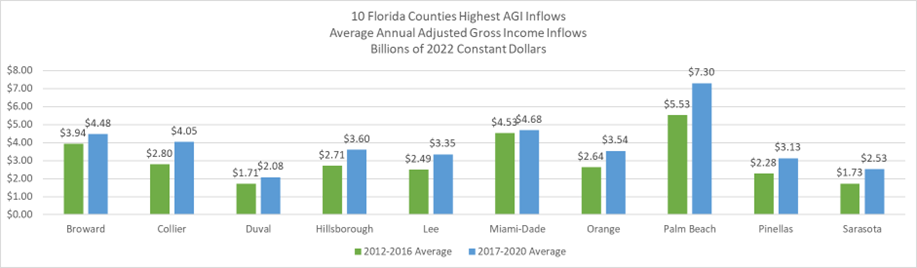
Chart 7 shows the 10 Florida Counties attracting the most households. Except for Broward and Miami-Dade, on average, the other eight counties (e.g., Hillsborough, Pasco, Pinellas, Polk) are attracting more households than in the period 2012-2016. Chart 8 shows that Hillsborough ranks 5th amongst Florida Counties attracting AGI Inflows. Three of the 10 counties with the highest AGI Inflows (i.e., Hillsborough, Pinellas, and Sarasota) are in the Tampa Bay Region. These inflows range from $2.08 billion (Duval County) to $7.3 billion (Palm Beach County).
Chart 7. 10 Florida Counties Attracting Most New Households
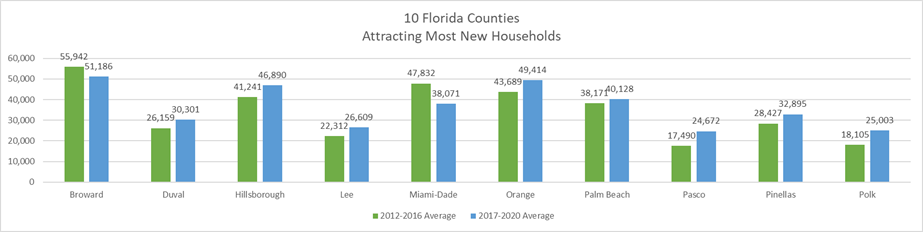
Chart 8. 10 Florida Counties with Highest AGI Inflows
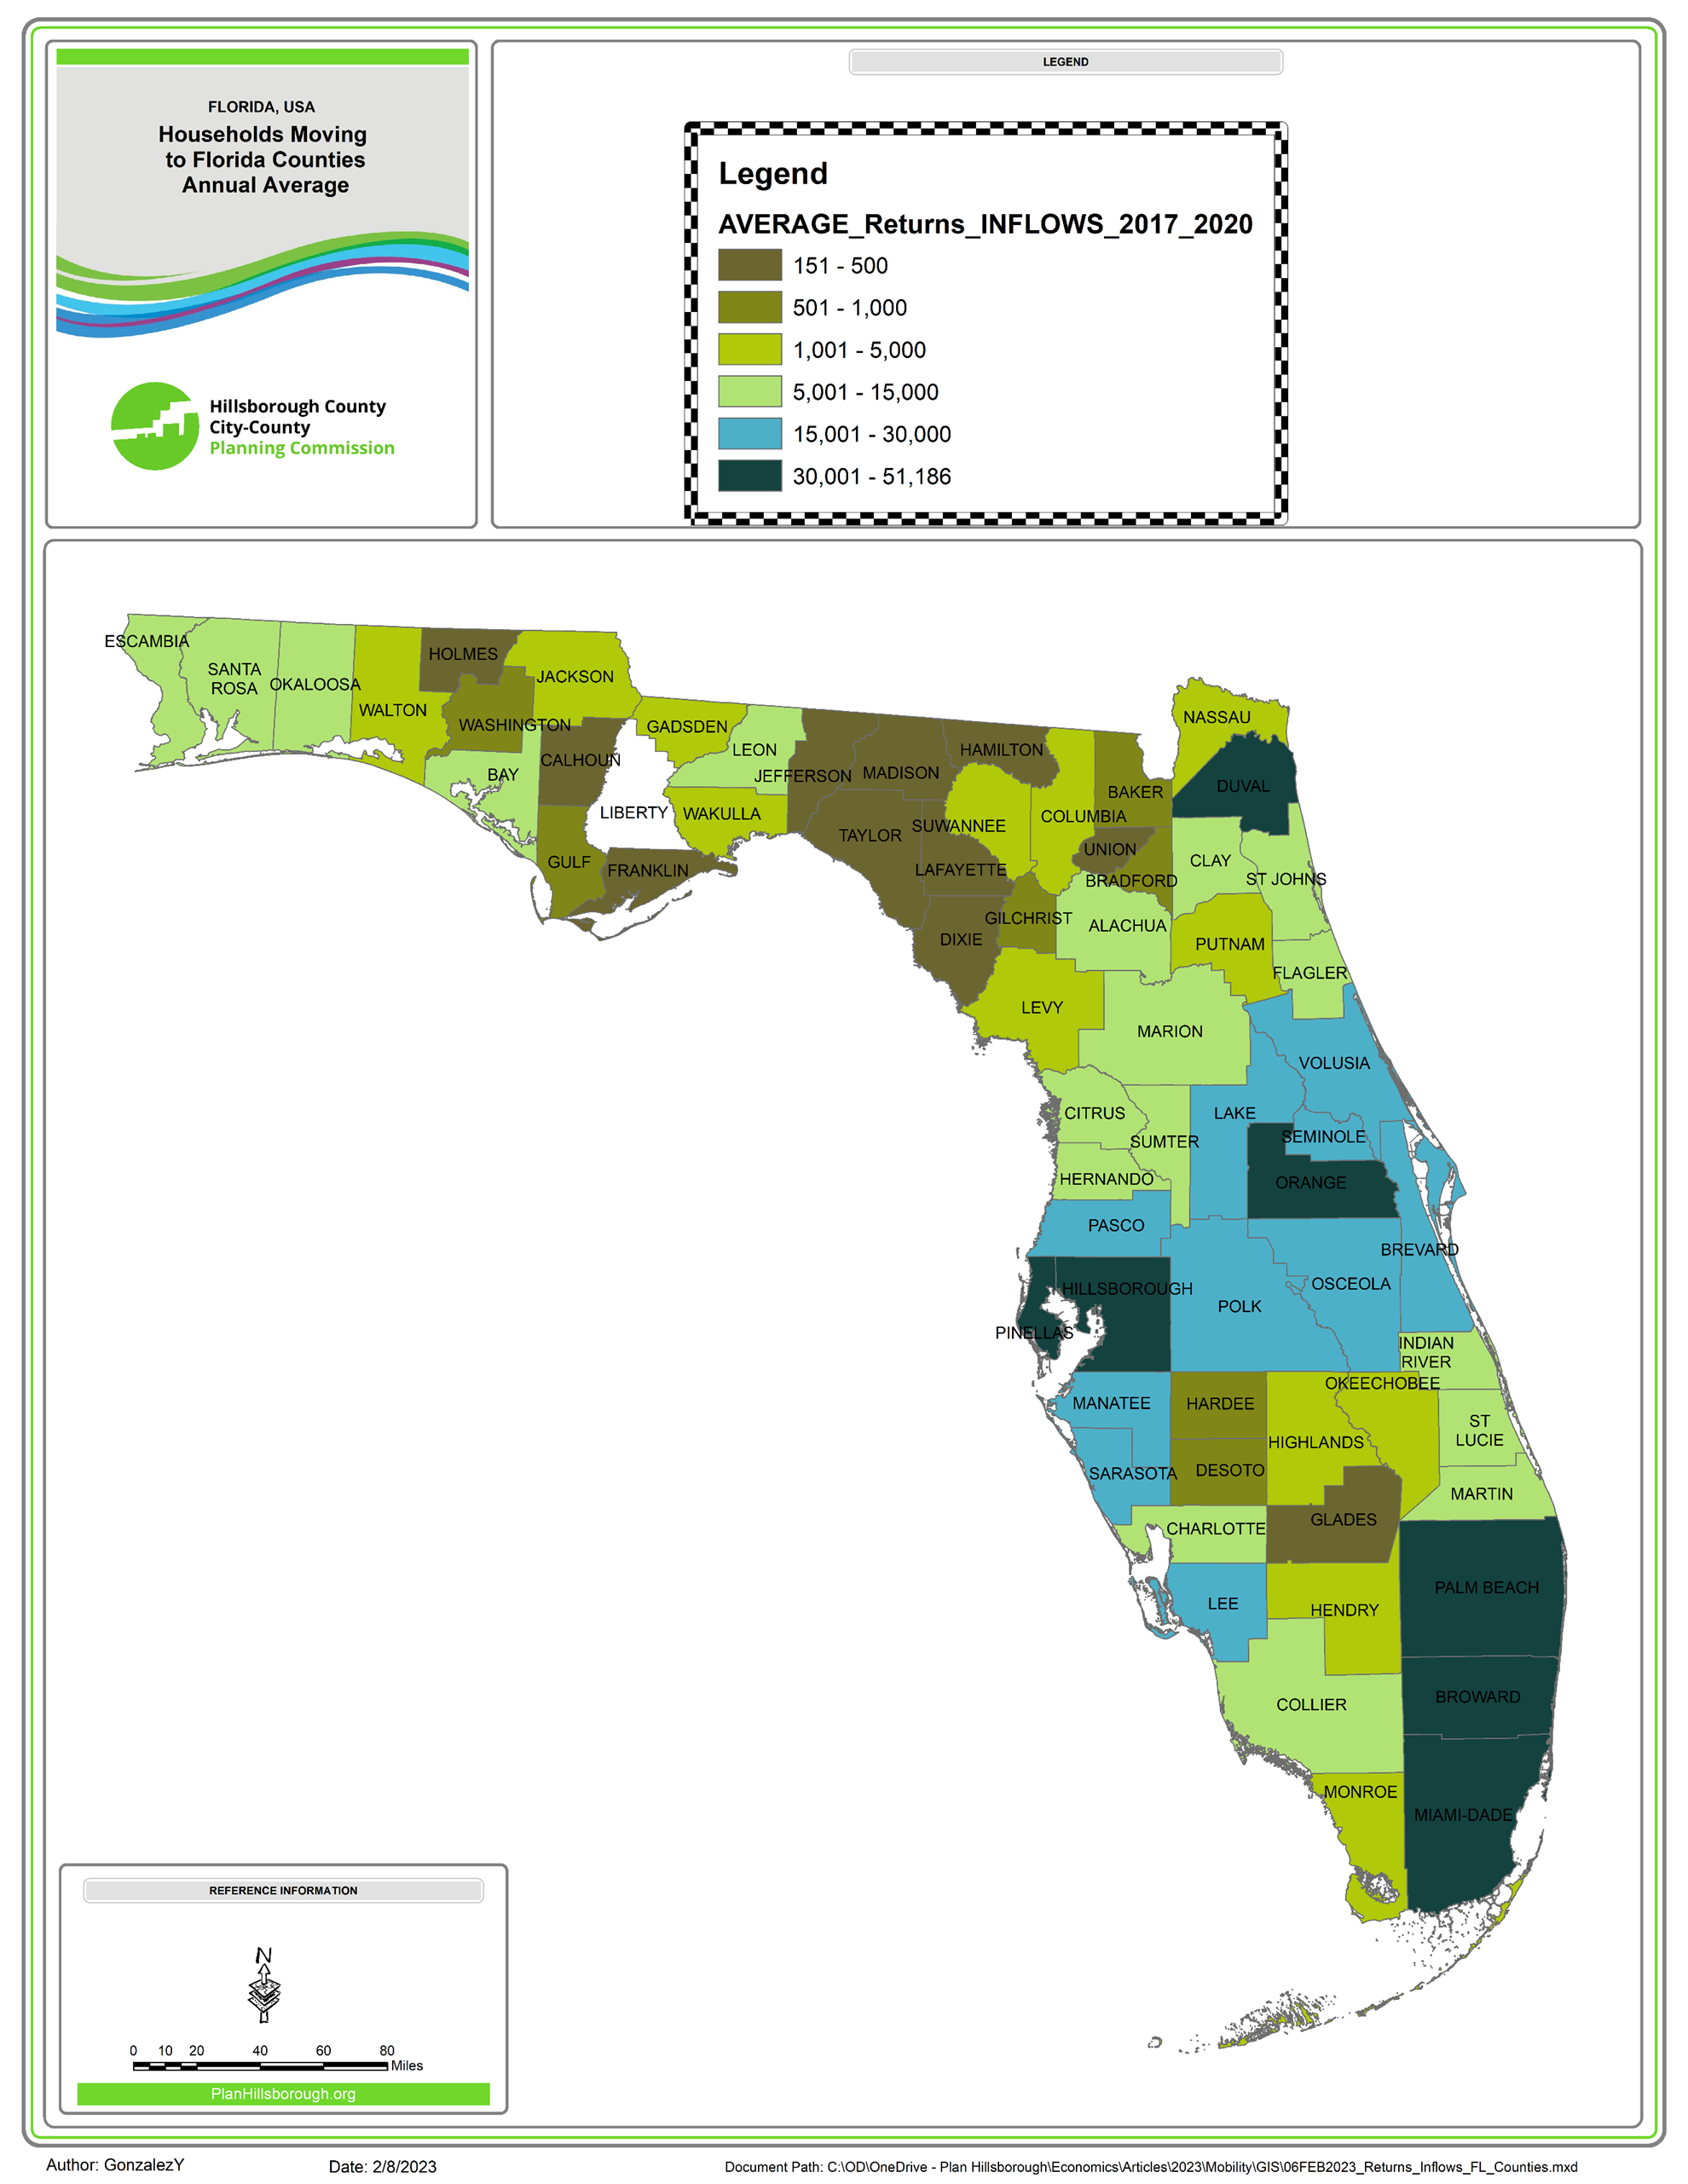
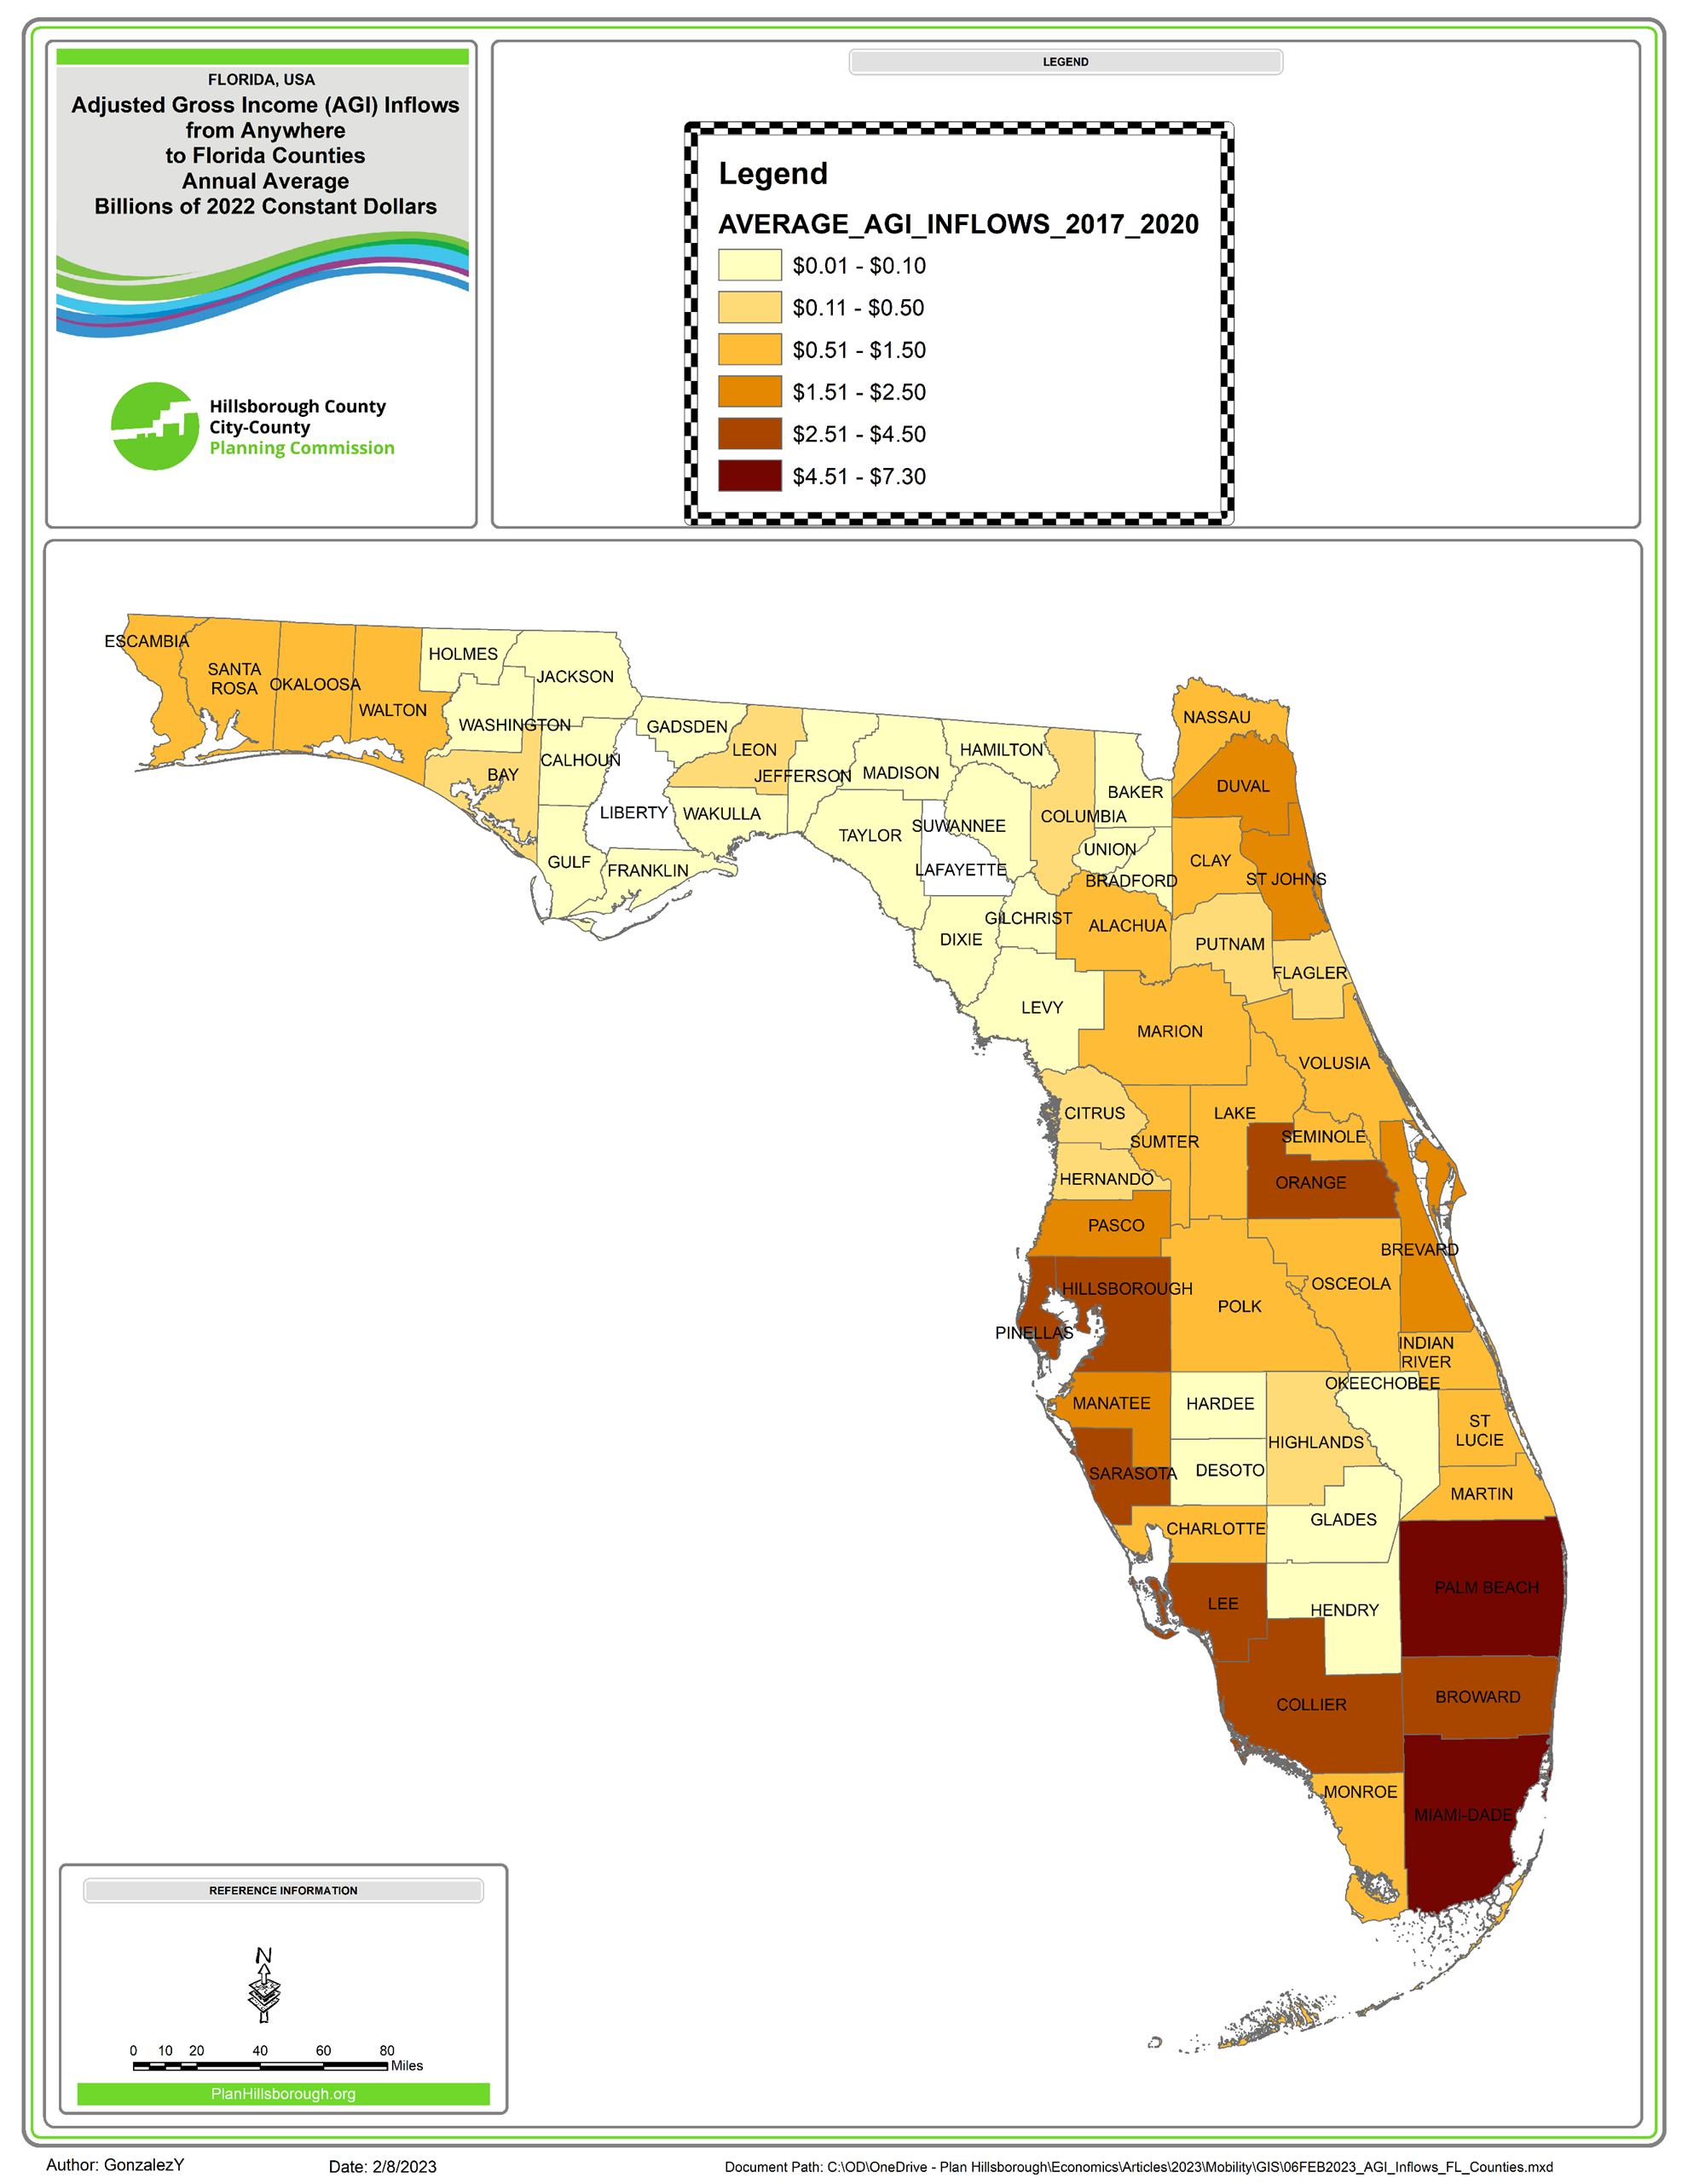
Map 3 shows Florida Counties classified by number of new households. As we can see, Hillsborough and Pinellas County are amongst the top destinations for new households (and AGI) moving to Florida. Map 4 shows how much AGI is being moved to Florida Counties. Hillsborough, Manatee, Pasco, and Pinellas are attracting over $1.5 billion AGI every year.
Map 3. New Households from Inside and Outside Florida to Florida Counties
Map 4. Average Adjusted Gross Income Flows to Florida Counties
To conclude, IRS migration data suggests that Hillsborough County captures a commanding share of new households and AGI inflows into Florida. On average, Hillsborough receives $3.6 billion annually. Nearby Orange, Pasco, Pinellas, and Polk are the top origins for new households and AGI Inflows into Hillsborough County. On average, the number of new households and AGI coming to Hillsborough has increased since 2017.
In the next article, we will be looking households and AGI moving out Hillsborough County. Moreover, we will be looking at whether more people are moving in or more moving out of Hillsborough County.
[i] Internal Revenue Service. Statistics of Income. 2012-2020 Migration Data. https://www.irs.gov/statistics/soi-tax-stats-migration-data
[ii] For the purposes of this article, an “IRS return” to represent one household. Most married couples filed jointly. See here: https://www.cbsnews.com/news/when-married-couples-should-file-separate-tax-returns/
[iii] Per convention, all monetary figures are shown in 2022 constant dollars. Calculations were done using CPI data for all urban consumers in Tampa-St. Petersburg-Clearwater, FL MSA (not seasonally adjusted). Link: https://www.bls.gov/cpi/data.htm