


Published
January 4, 2023
Contact
Yassert A. Gonzalez | Manager – Economics, Demographics & Research | 813-582-7356 (o) | [email protected] | planhillsborough.org
Last updated
July 17, 2023
According to the Bureau of Economic and Business Research (BEBR), in 2022, Hillsborough County reached 1.5 million residents. Meanwhile, the City of Tampa reached 400,000 residents[i]. The conventional wisdom is that these milestones were reached sooner than expected because growth has accelerated since the pandemic[ii][iii]. We decided to test this hypothesis. We compared population growth for periods 2018-2020 and 2020-2022[iv]. The evidence is mixed.
Table 1. Population estimates and growth for Hillsborough County Jurisdictions
| Jurisdiction | 2018 | 2020 | 2022 | 2018-2020 Population Growth | 2020-2022 Population Growth | Higher Growth Since 2020? |
| Plant City | 38,938 | 39,846 | 40,365 | 2.33% | 1.30% | No |
| Tampa | 378,531 | 392,953 | 401,512 | 3.81% | 2.18% | No |
| Temple Terrace | 26,512 | 26,832 | 27,251 | 1.21% | 1.56% | Yes |
| Unincorporated Hillsborough County | 964,883 | 1,019,128 | 1,051,401 | 5.62% | 3.17% | No |
| Total | 1,408,864 | 1,478,759 | 1,520,529 | 4.96% | 2.82% | No |
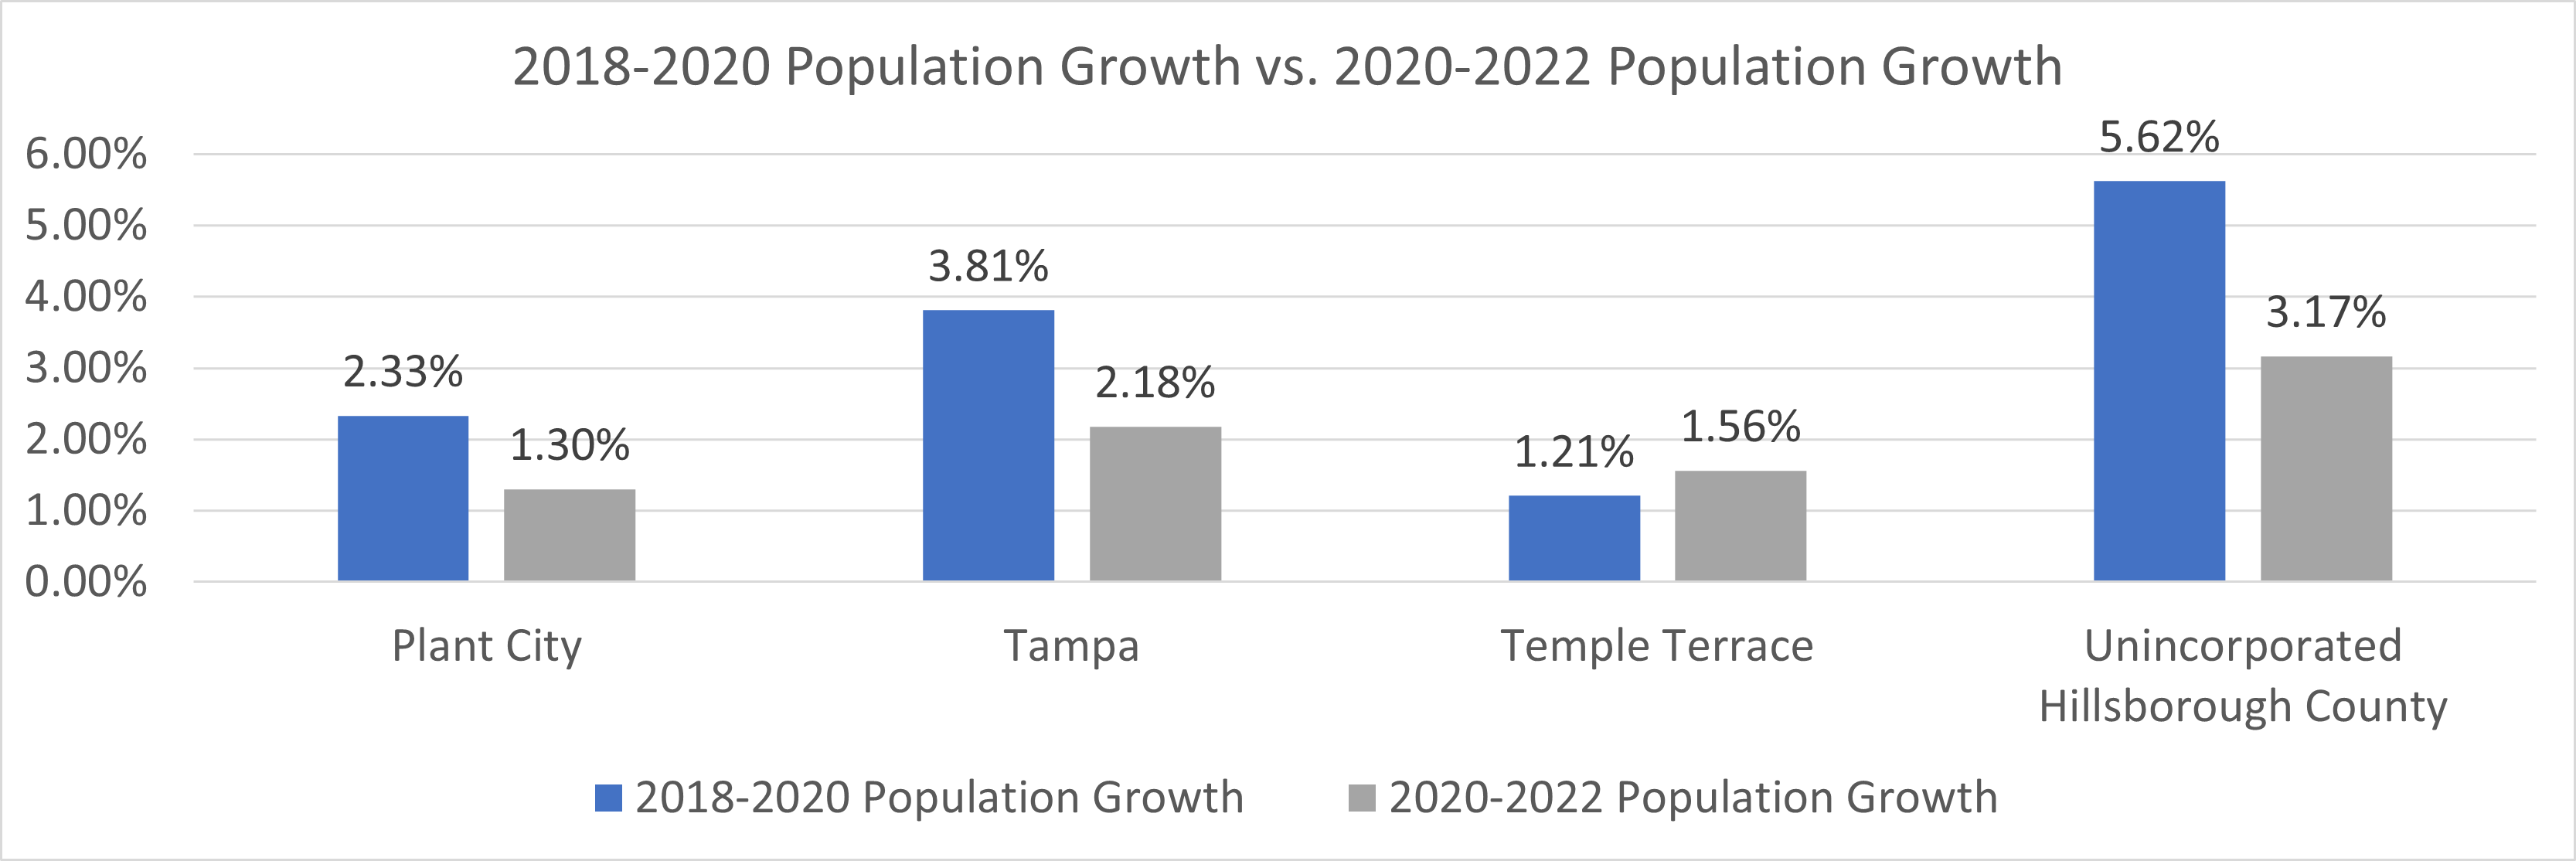
Chart 1. Comparing 2018-2020 Population Growth vs. 2020-2022 Population Growth for Hillsborough County Jurisdictions
As seen in Table 1 and Chart 1, population growth in Hillsborough County’s jurisdictions has not accelerated since 2020. Except for Temple Terrace, 2018-2020 population growth was higher. Even in the case of Temple Terrace, 2020-2022 population growth was only slightly higher.
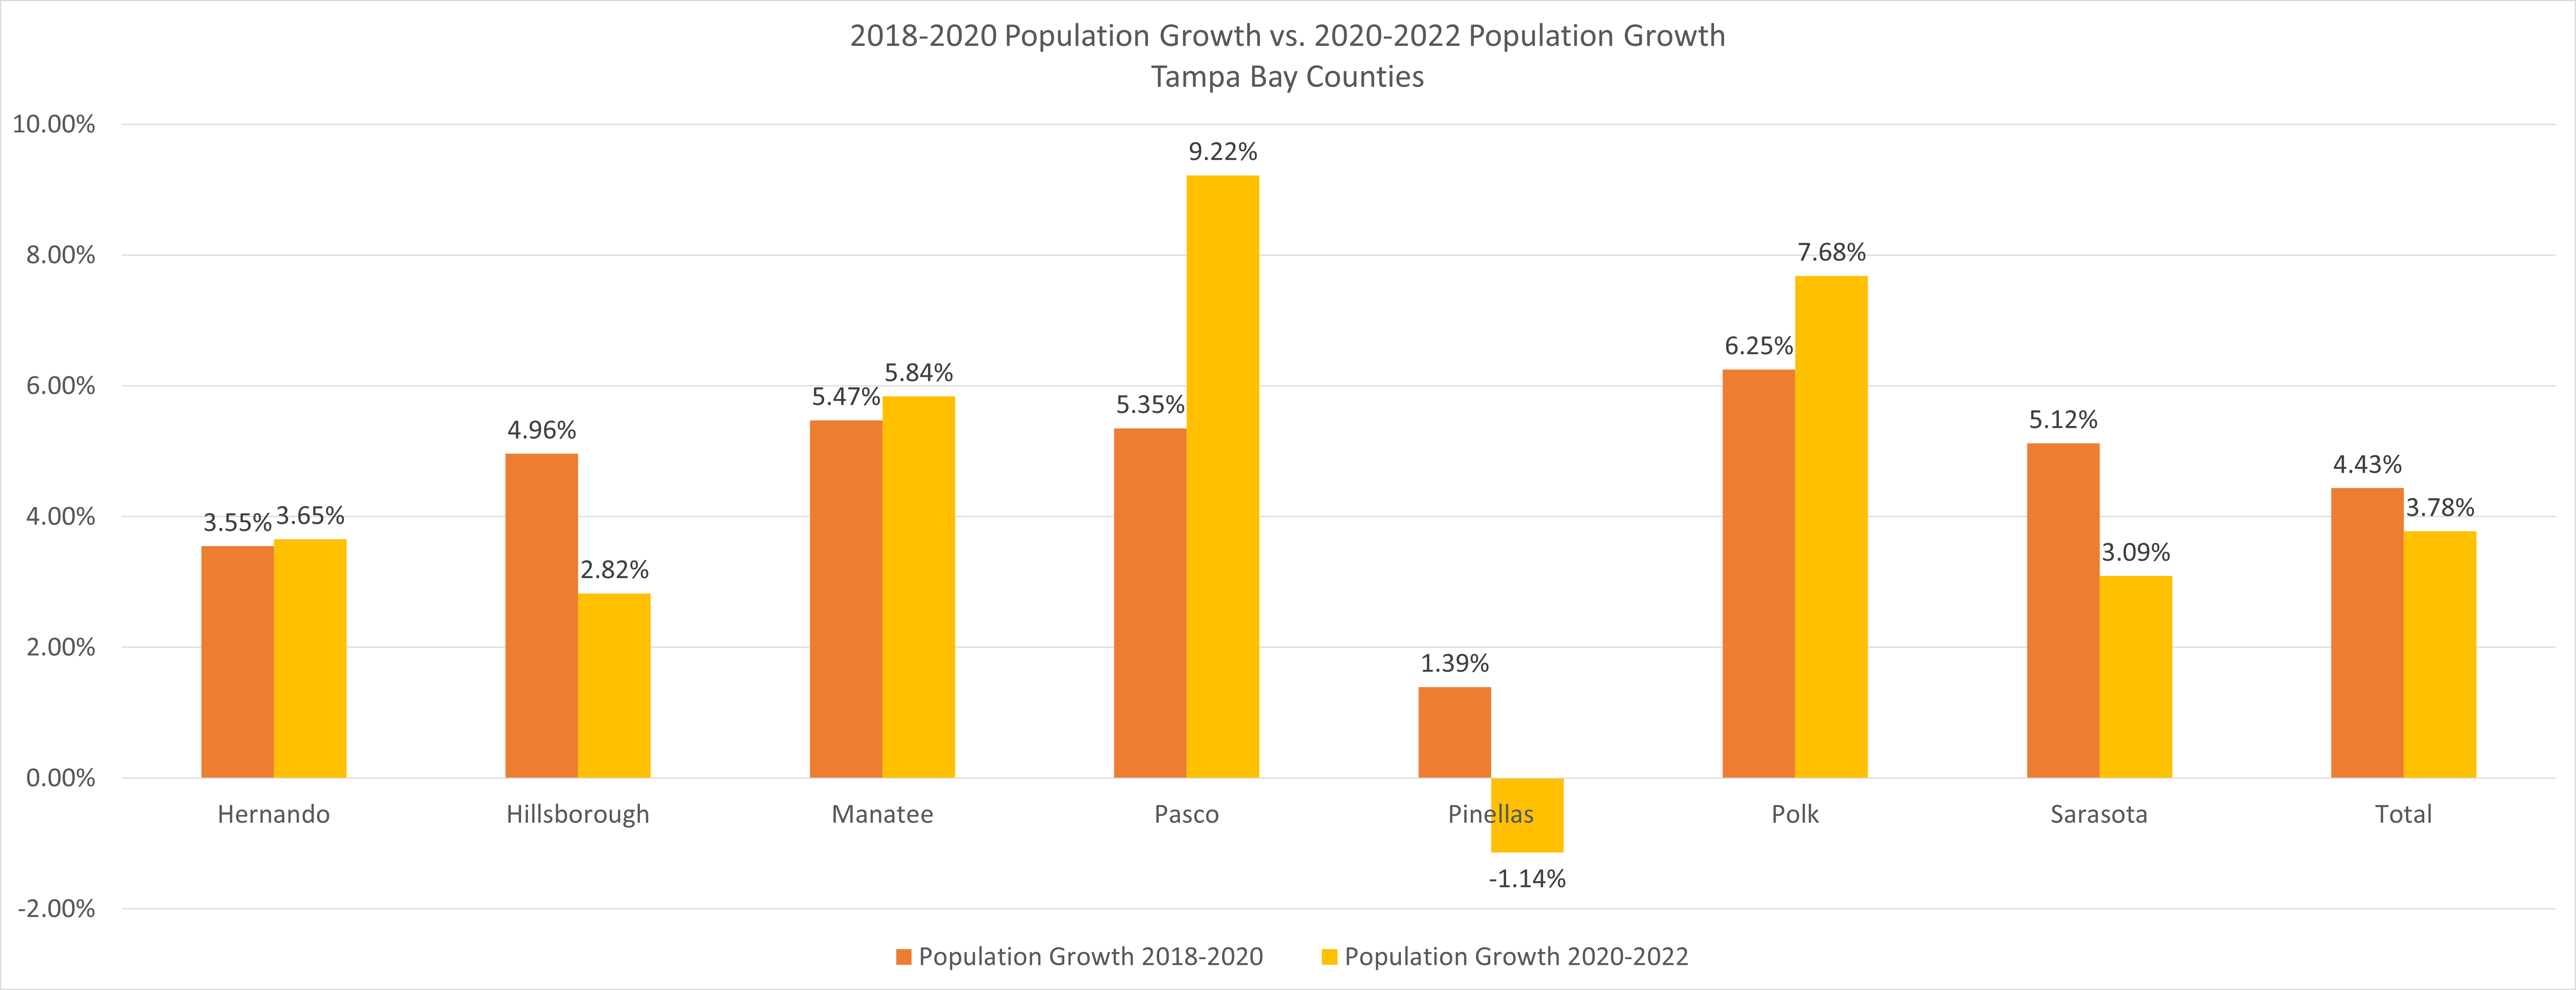
We also looked at 7 counties in Tampa Bay. Four of these 7 counties (i.e., Hernando, Manatee, Pasco, and Polk) did see higher population growth since 2020 (See Table 2 and Chart 2). For the period 2020-2022, Pasco and Polk Counties’ growth was 72% and 22% higher than in 2018-2020 period, respectively. Interestingly, amongst these 7 counties, Hillsborough County has one of the lowest growth rates since 2020. Its 2020-2022 growth rate is less than 60% of the growth rates for the period 2018-2020. In the case of Pinellas, BEBR is showing a decline in population since 2020[v].
Table 2. Population estimates and growth for Tampa Bay Counties
| Tampa Bay County | 2018 | 2020 | 2022 | Population Growth 2018-2020 | Population Growth 2020-2022 | Higher Growth Since 2020? |
| Hernando | 185,604 | 192,186 | 199,207 | 3.55% | 3.65% | Yes |
| Hillsborough | 1,408,864 | 1,478,759 | 1,520,529 | 4.96% | 2.82% | No |
| Manatee | 377,826 | 398,503 | 421,768 | 5.47% | 5.84% | Yes |
| Pasco | 515,077 | 542,638 | 592,669 | 5.35% | 9.22% | Yes |
| Pinellas | 970,532 | 984,054 | 972,852 | 1.39% | -1.14% | No |
| Polk | 673,028 | 715,090 | 770,019 | 6.25% | 7.68% | Yes |
| Sarasota | 417,442 | 438,816 | 452,378 | 5.12% | 3.09% | No |
| Total | 4,548,373 | 4,750,046 | 4,929,422 | 4.43% | 3.78% | No |
Chart 2. Comparing 2018-2020 Population Growth vs. 2020-2022 Population Growth for Tampa Bay Counties
As we have seen, Hillsborough County jurisdictions continue to grow. Although their 2020-2022 population growth rates are lower than their growth rates for their period 2018-2020, the county is still on track to reach nearly 2 million residents by 2050[vi]. However, the demographic data does not appear to support the conventional wisdom that population growth has accelerated everywhere in Florida since 2020. Only four of seven counties in Tampa Bay have seen their population growth increase significantly since 2020.
[i] Bureau of Economic and Business Research. Florida Estimates of Population 2022. University of Florida. https://www.bebr.ufl.edu/population_page_repo/florida-estimates-of-population-2022/
[ii] Hylton, Garfield. Orland Sentinel. Florida ranked among most popular states for move-ins during pandemic, survey says. January 26, 2022. https://www.orlandosentinel.com/news/florida/os-ne-florida-ranked-one-of-most-popular-states-for-move-ins-pandemic-20220126-esu452skarbodizshvqe5bjx7m-story.html
[iii] Spata, Christopher. Tampa Bay Times. Fleeing to Florida? New arrivals explain why they moved to Tampa Bay. February 24, 2022. https://www.tampabay.com/news/florida/2022/02/24/fleeing-to-florida-new-arrivals-explain-why-they-moved-to-tampa-bay/
[iv] Growth rates calculated from population estimates published by the Bureau of Economic and Business Research. Florida Estimates of Population for 2018, 2020, and 2022. University of Florida. https://www.bebr.ufl.edu/population/population-data-archive/
[v] We took a closer look at the jurisdictional-level estimates for Pinellas. According to the BEBR estimates, Clearwater, Largo, Pinellas Park, and St. Petersburg, also did not show higher growth since 2020.
[vi] Bureau of Economic and Business Research. Projections of Florida Population by County, 2025-2050, with estimates for 2021. University of Florida. https://www.bebr.ufl.edu/population_page_repo/projections-of-florida-population-by-county-2025-2050-with-estimates-for-2021/