In 2023, Tampa and UHC Issued Least Residential Permits Since 2019
Published March 1, 2024
Contact Yassert A. Gonzalez
Manager – Economics, Demographics & Research
813-582-7356 (o)
[email protected]
planhillsborough.org
Last updated February 22, 2024
The Planning Commission compiles and standardizes building permit data from all four jurisdictions in Hillsborough County. We have built several interactive maps that allow decisionmakers and the public to review building permits issued throughout the county. Naturally, we constantly analyze building permit data in search of trends. In this blog post, we will be looking at residential and commercial building permits issued in the last ten years (2014-2023) and the last 10 quarters (i.e., July-September 2021 to October-December 2023). As we will see, countywide building permits have been trending down for several years. More specifically, Tampa and Unincorporated Hillsborough County (UHC) have been issuing less permits every year since 2019. Then again, Plant City and Temple Terrace have been issuing more building permits. We will discuss them in the next installment.
We asked county and city staff about this persistent decline in residential building permits issued. They confirmed the downward trend. They also saw an uptick of multi-family residential building permits. Clearly, it was not enough to reverse course. County and city staff cited high interest rates, high home prices, a skilled labor shortage, and pricier building materials. [i][ii] Recently, Zonda’s Economist Ali Wolf and Advisory Manager, Larry Buckner, discussed how home builders are relying on incentives (e.g., interest rates buydowns, funds towards closing costs, flex cash) to sell their built inventory. [iii] Logically, if sales are slow, builders will be less likely to start new homes. For building permit numbers and visual details, see the charts below.
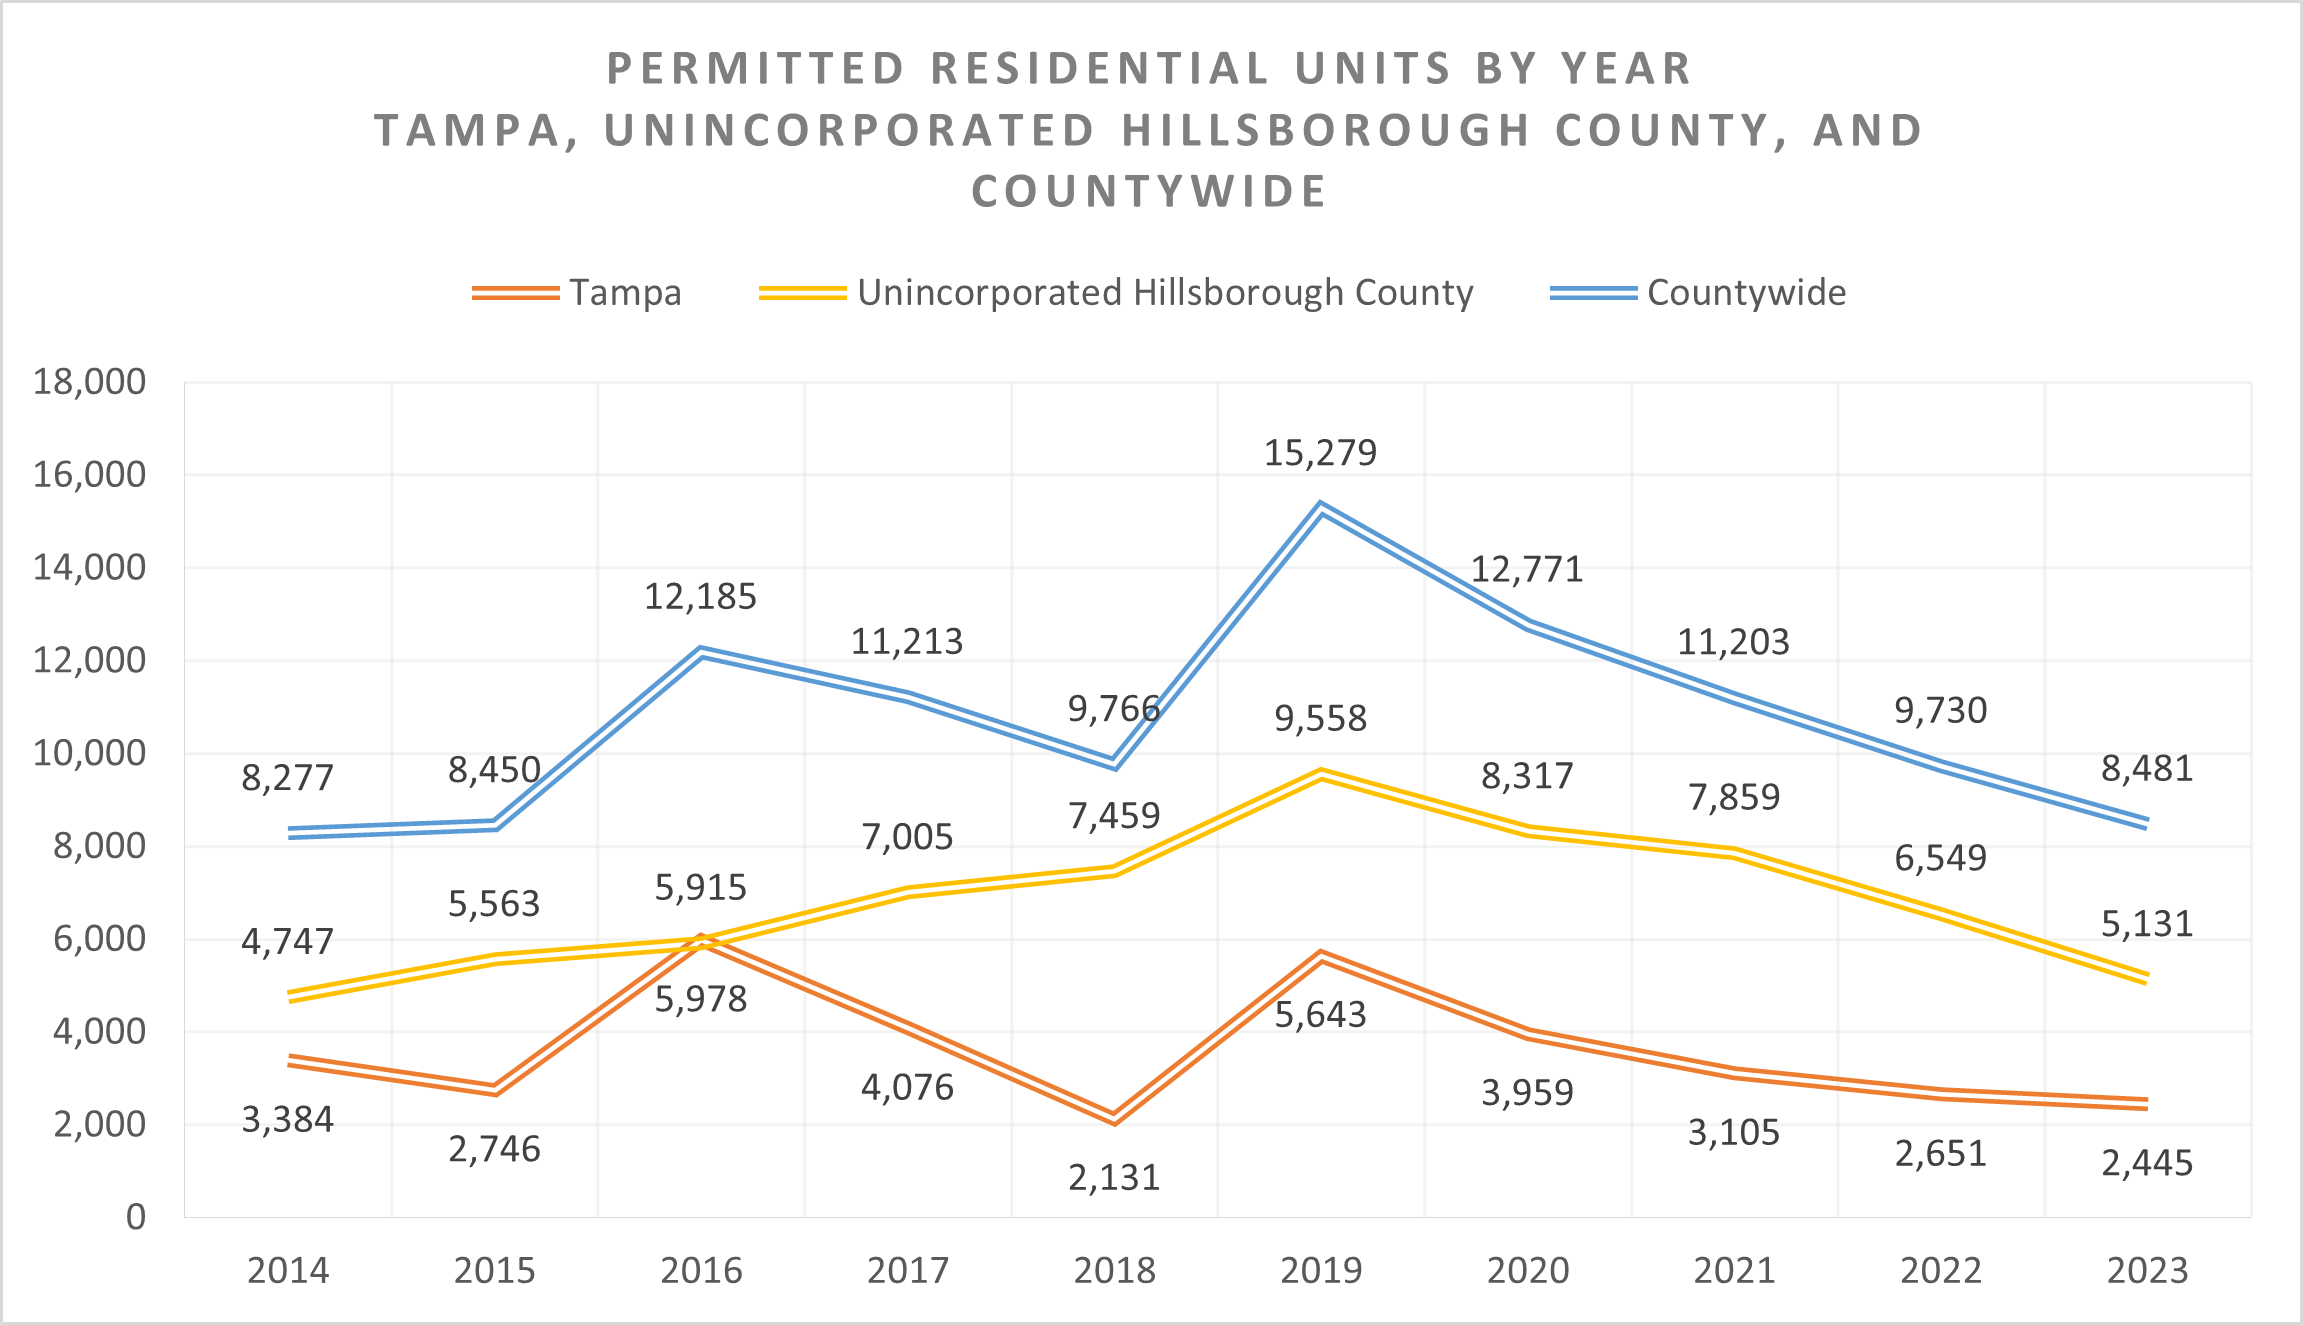
Figure 1 shows that in the last 10 years (2014-2023), permitted residential units in Tampa swung dramatically prior to 2019 and have been decreasing ever since. For Unincorporated Hillsborough County, permitted residential units increased every year from 2014 to 2019 and have been decreasing since. Countywide, permitted residential units followed Tampa’s pattern. They zig zagged before 2019 and have been decreasing since.
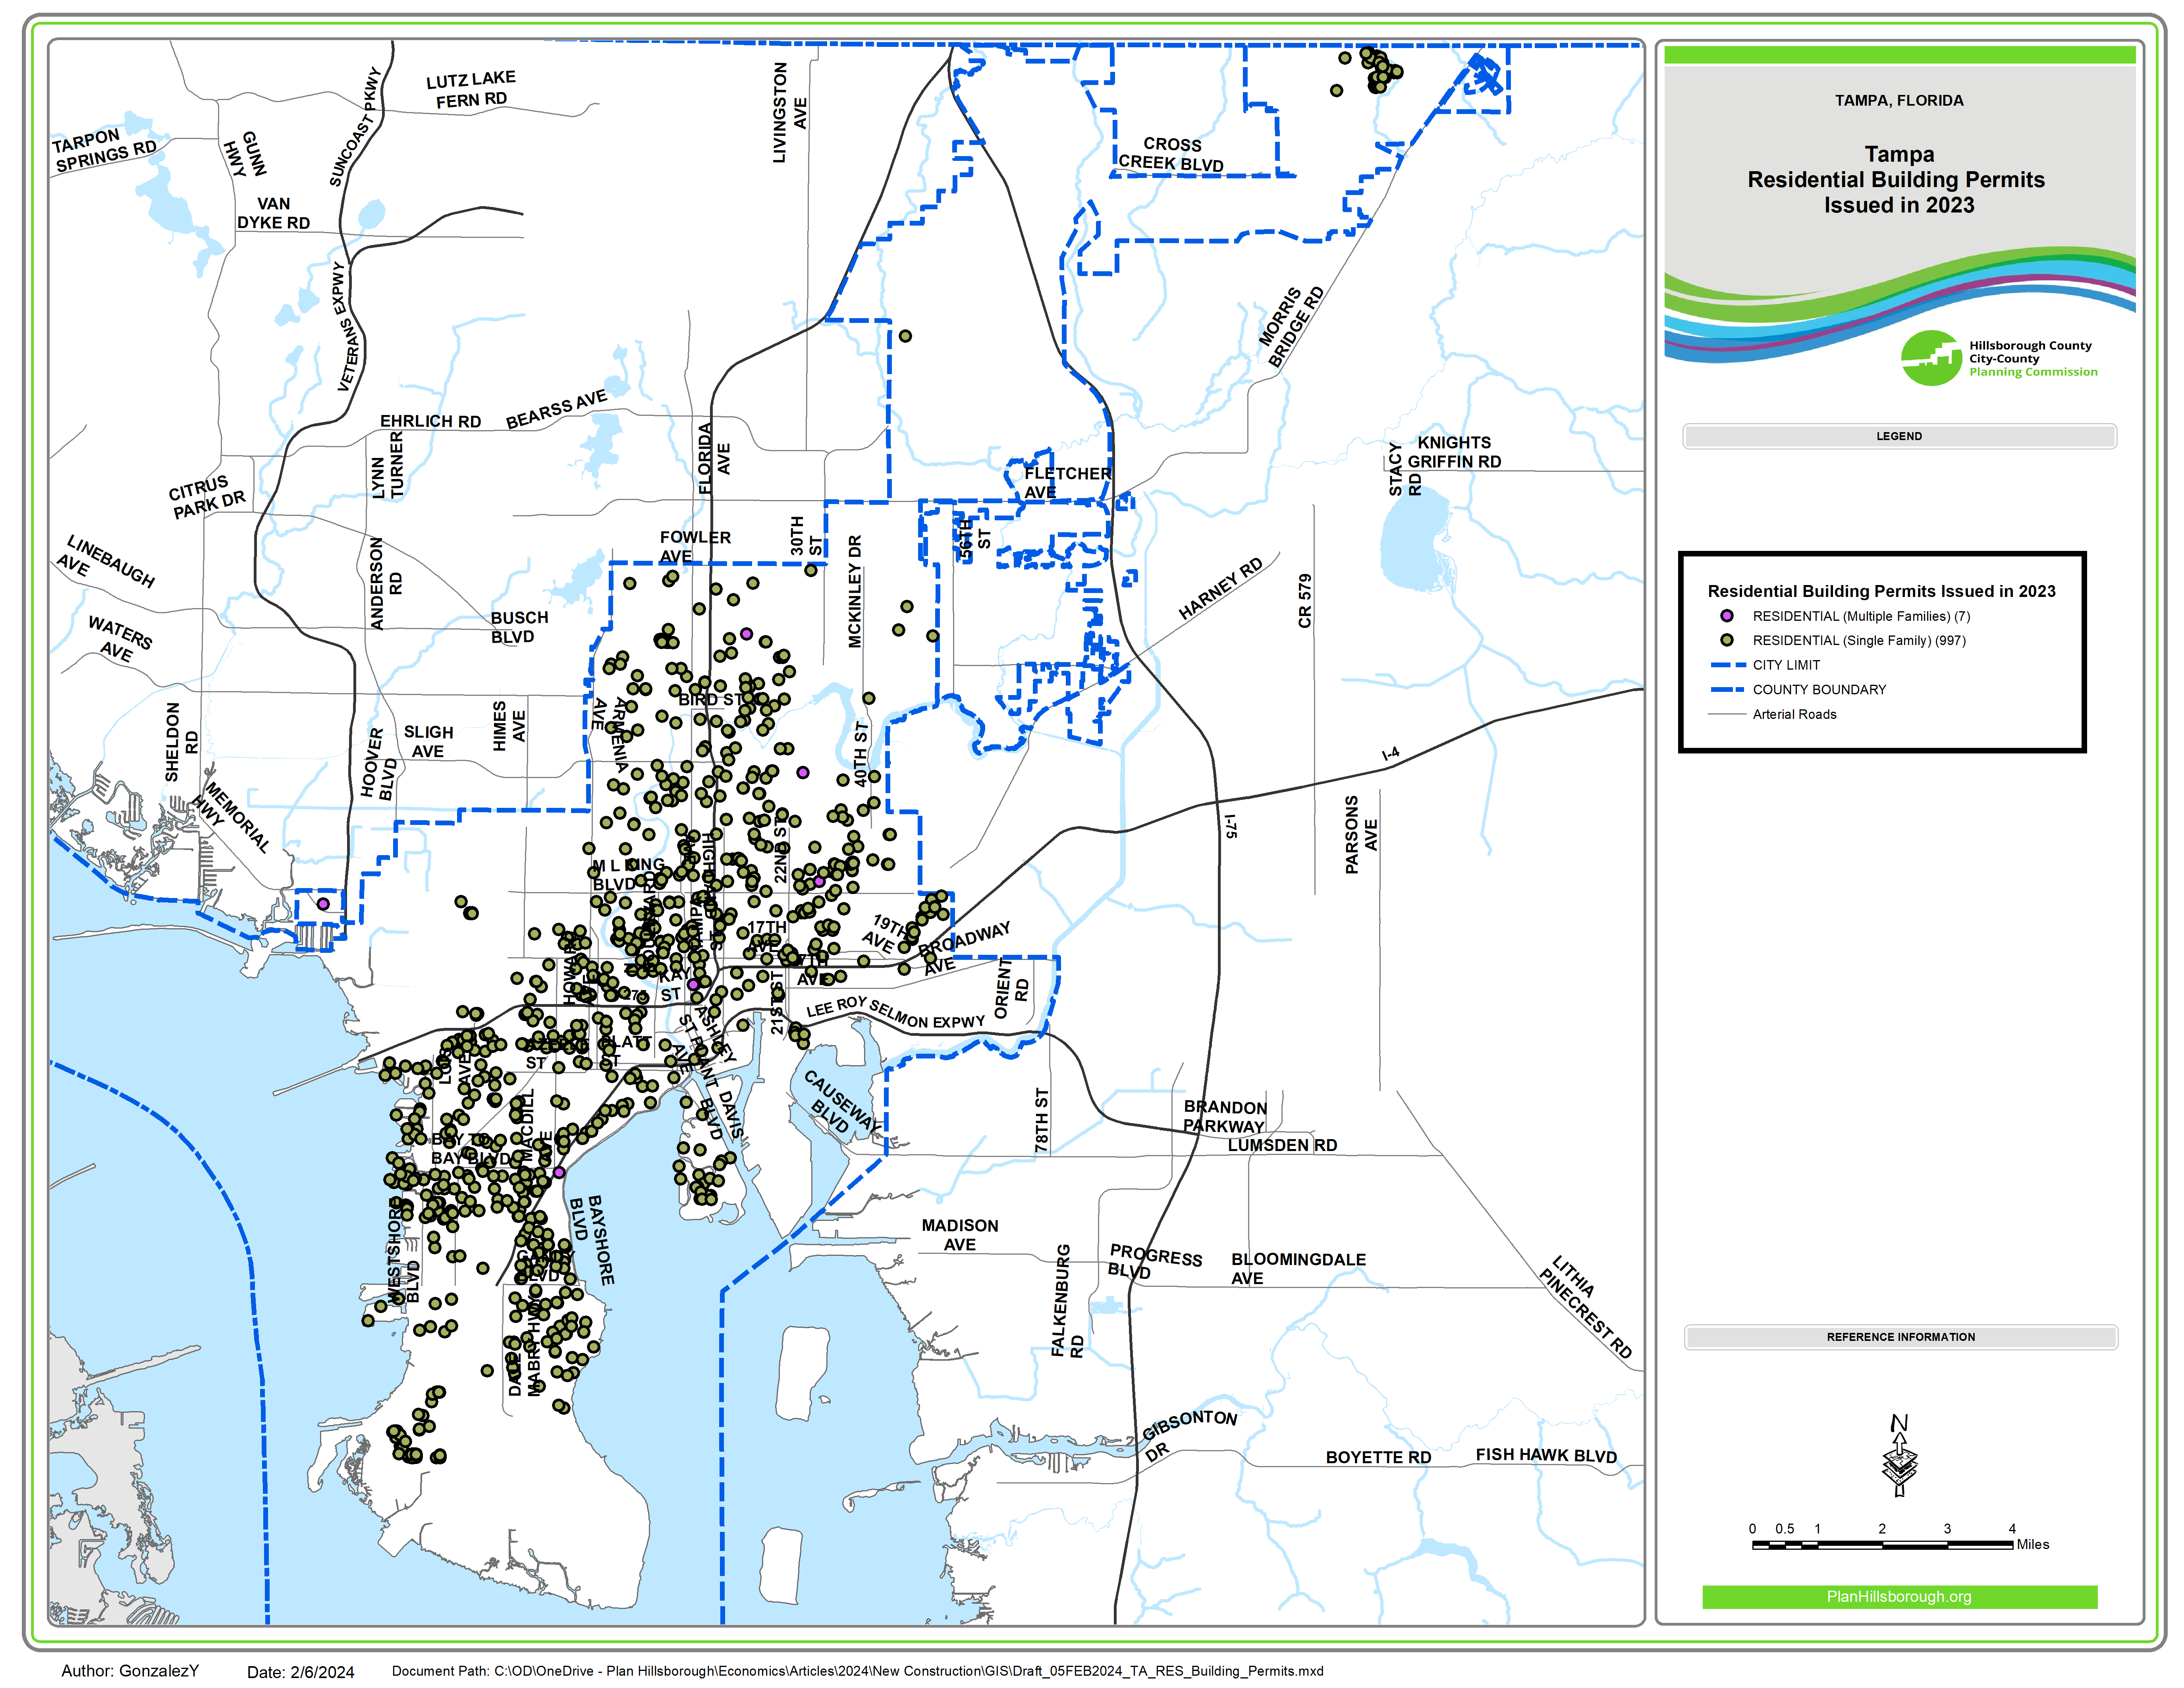
Map 1. Permitted Residential Units in 2023 – Tampa
Map 1 shows 2023 residential building permits issued in Tampa. Most of these permits were issued in Central and South Tampa. There were 997 building permits for single family homes and 7 building permits for multifamily homes.
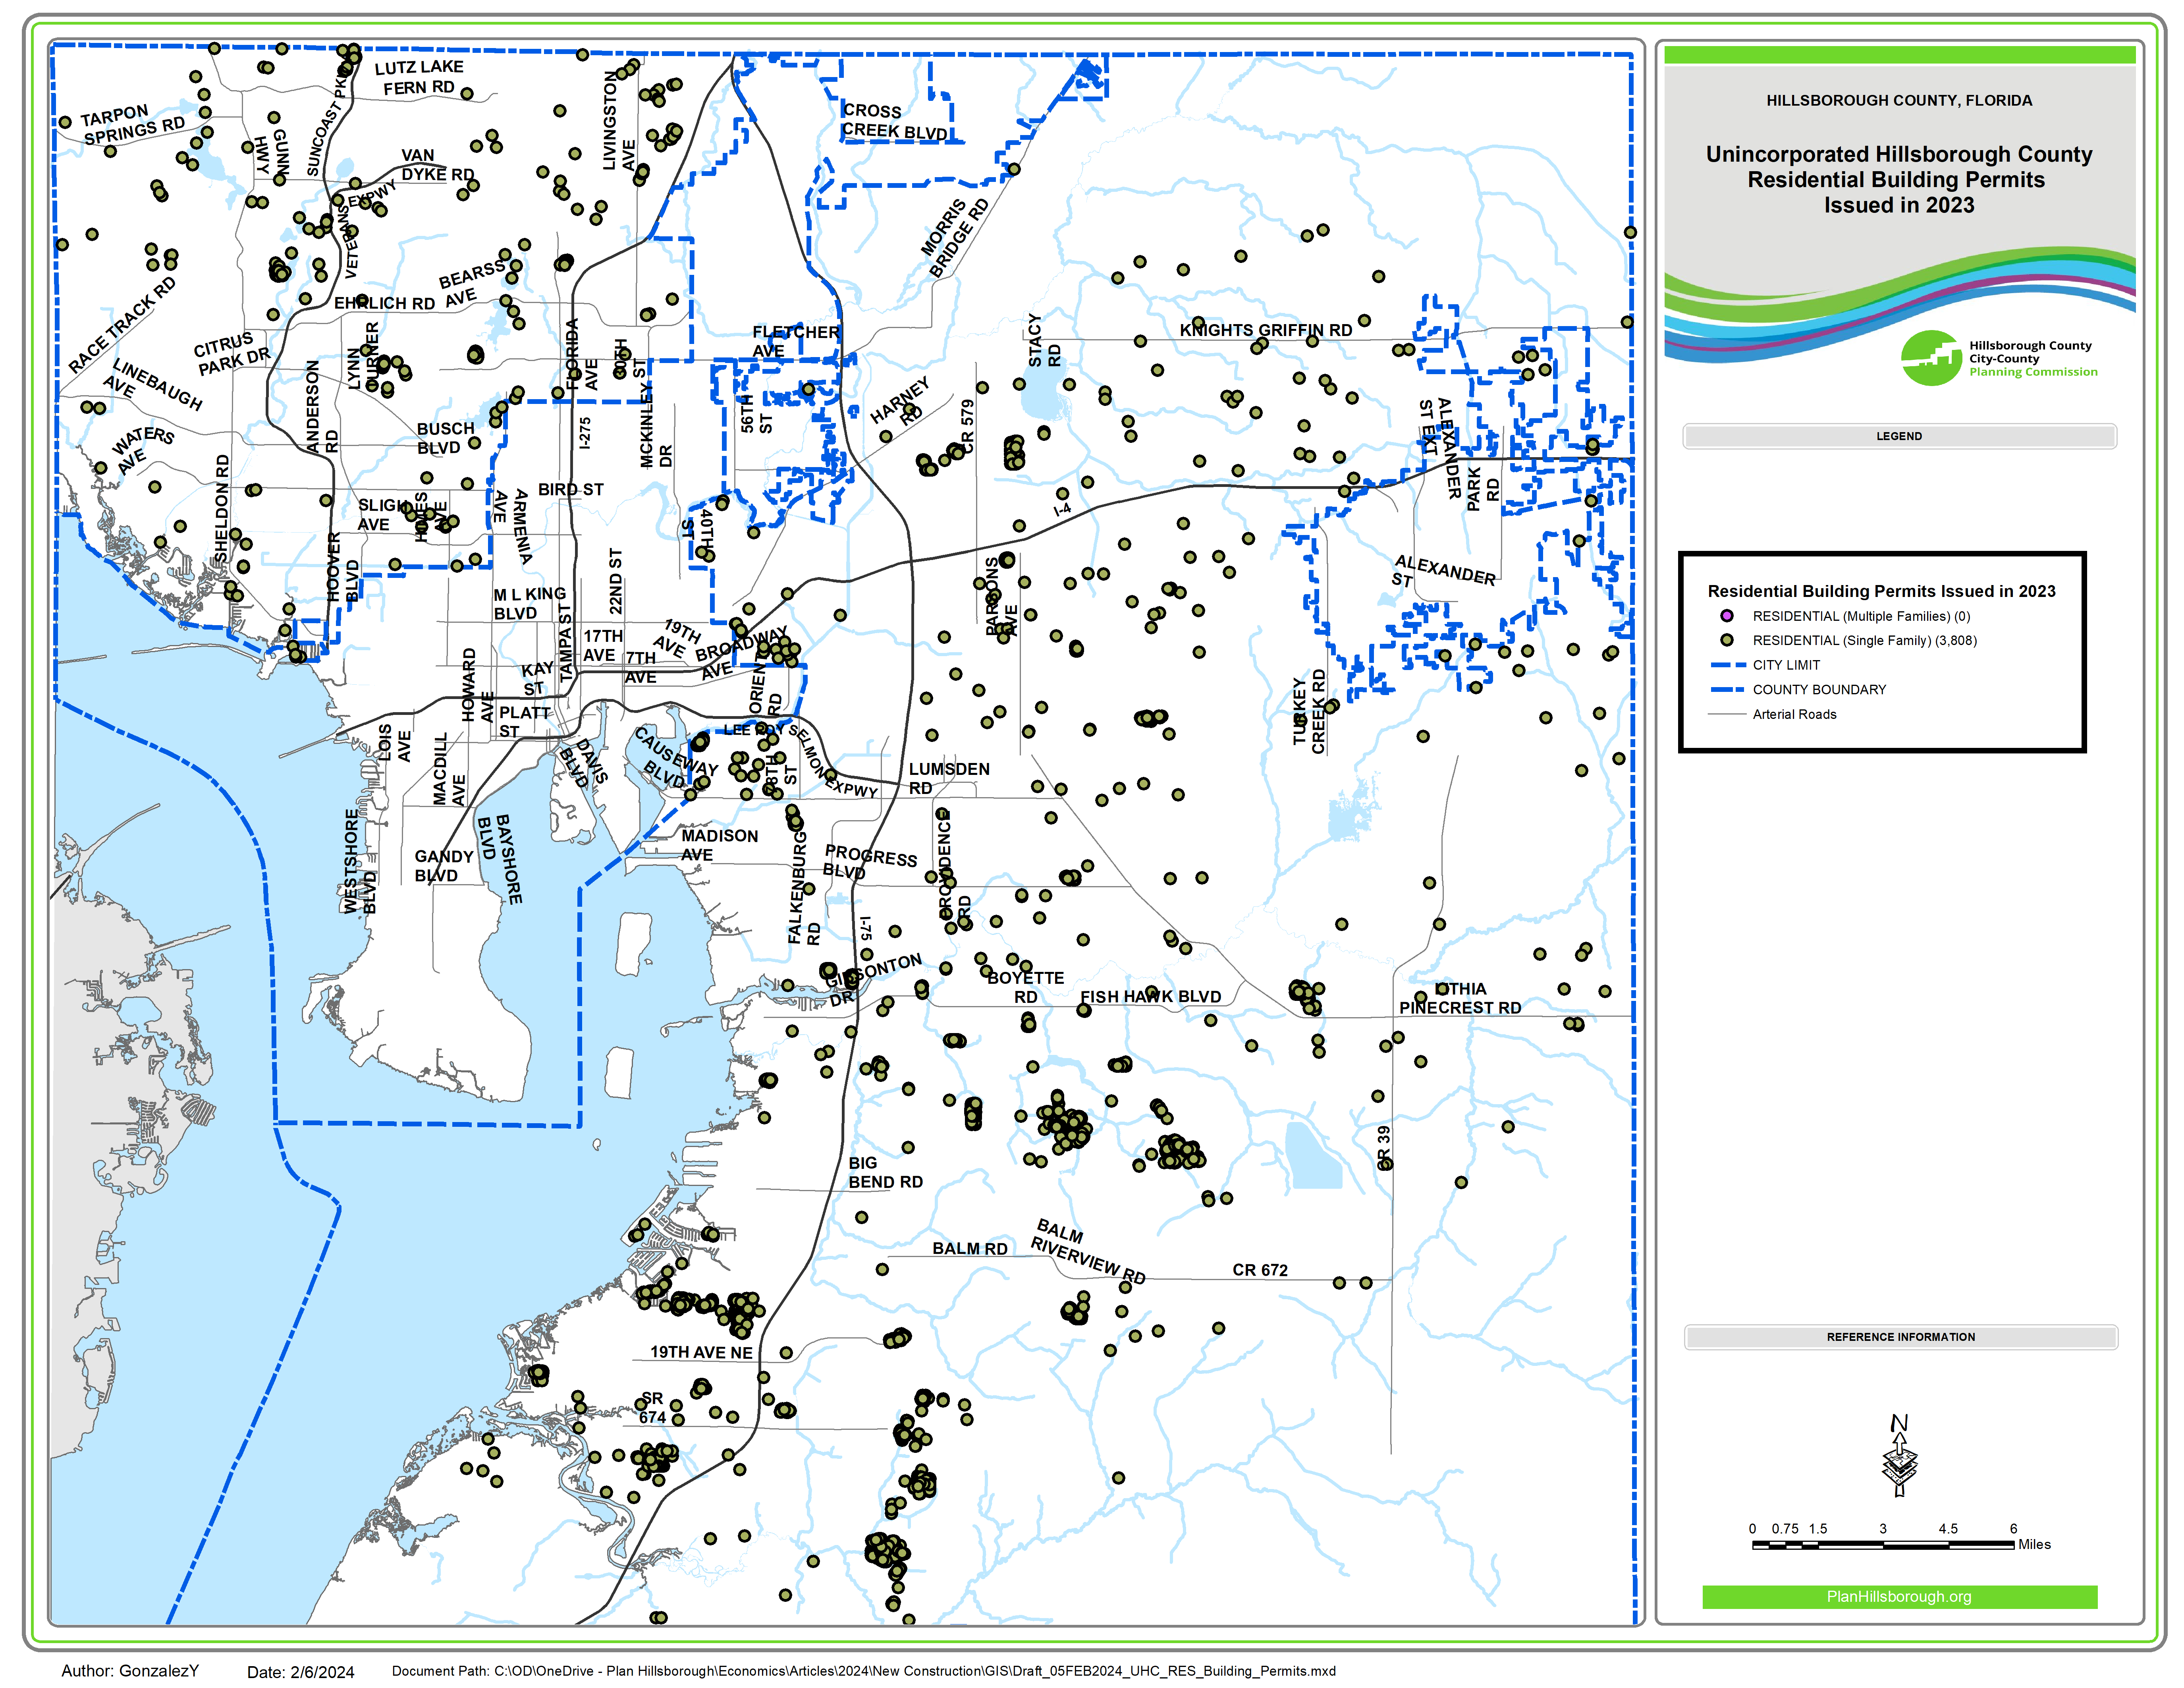
Map 2. Permitted Residential Units in 2023 – Unincorporated Hillsborough County
Map 2 shows 2023 residential building permits issued in Unincorporated Hillsborough County. There were 3,808 building permits for single family homes.
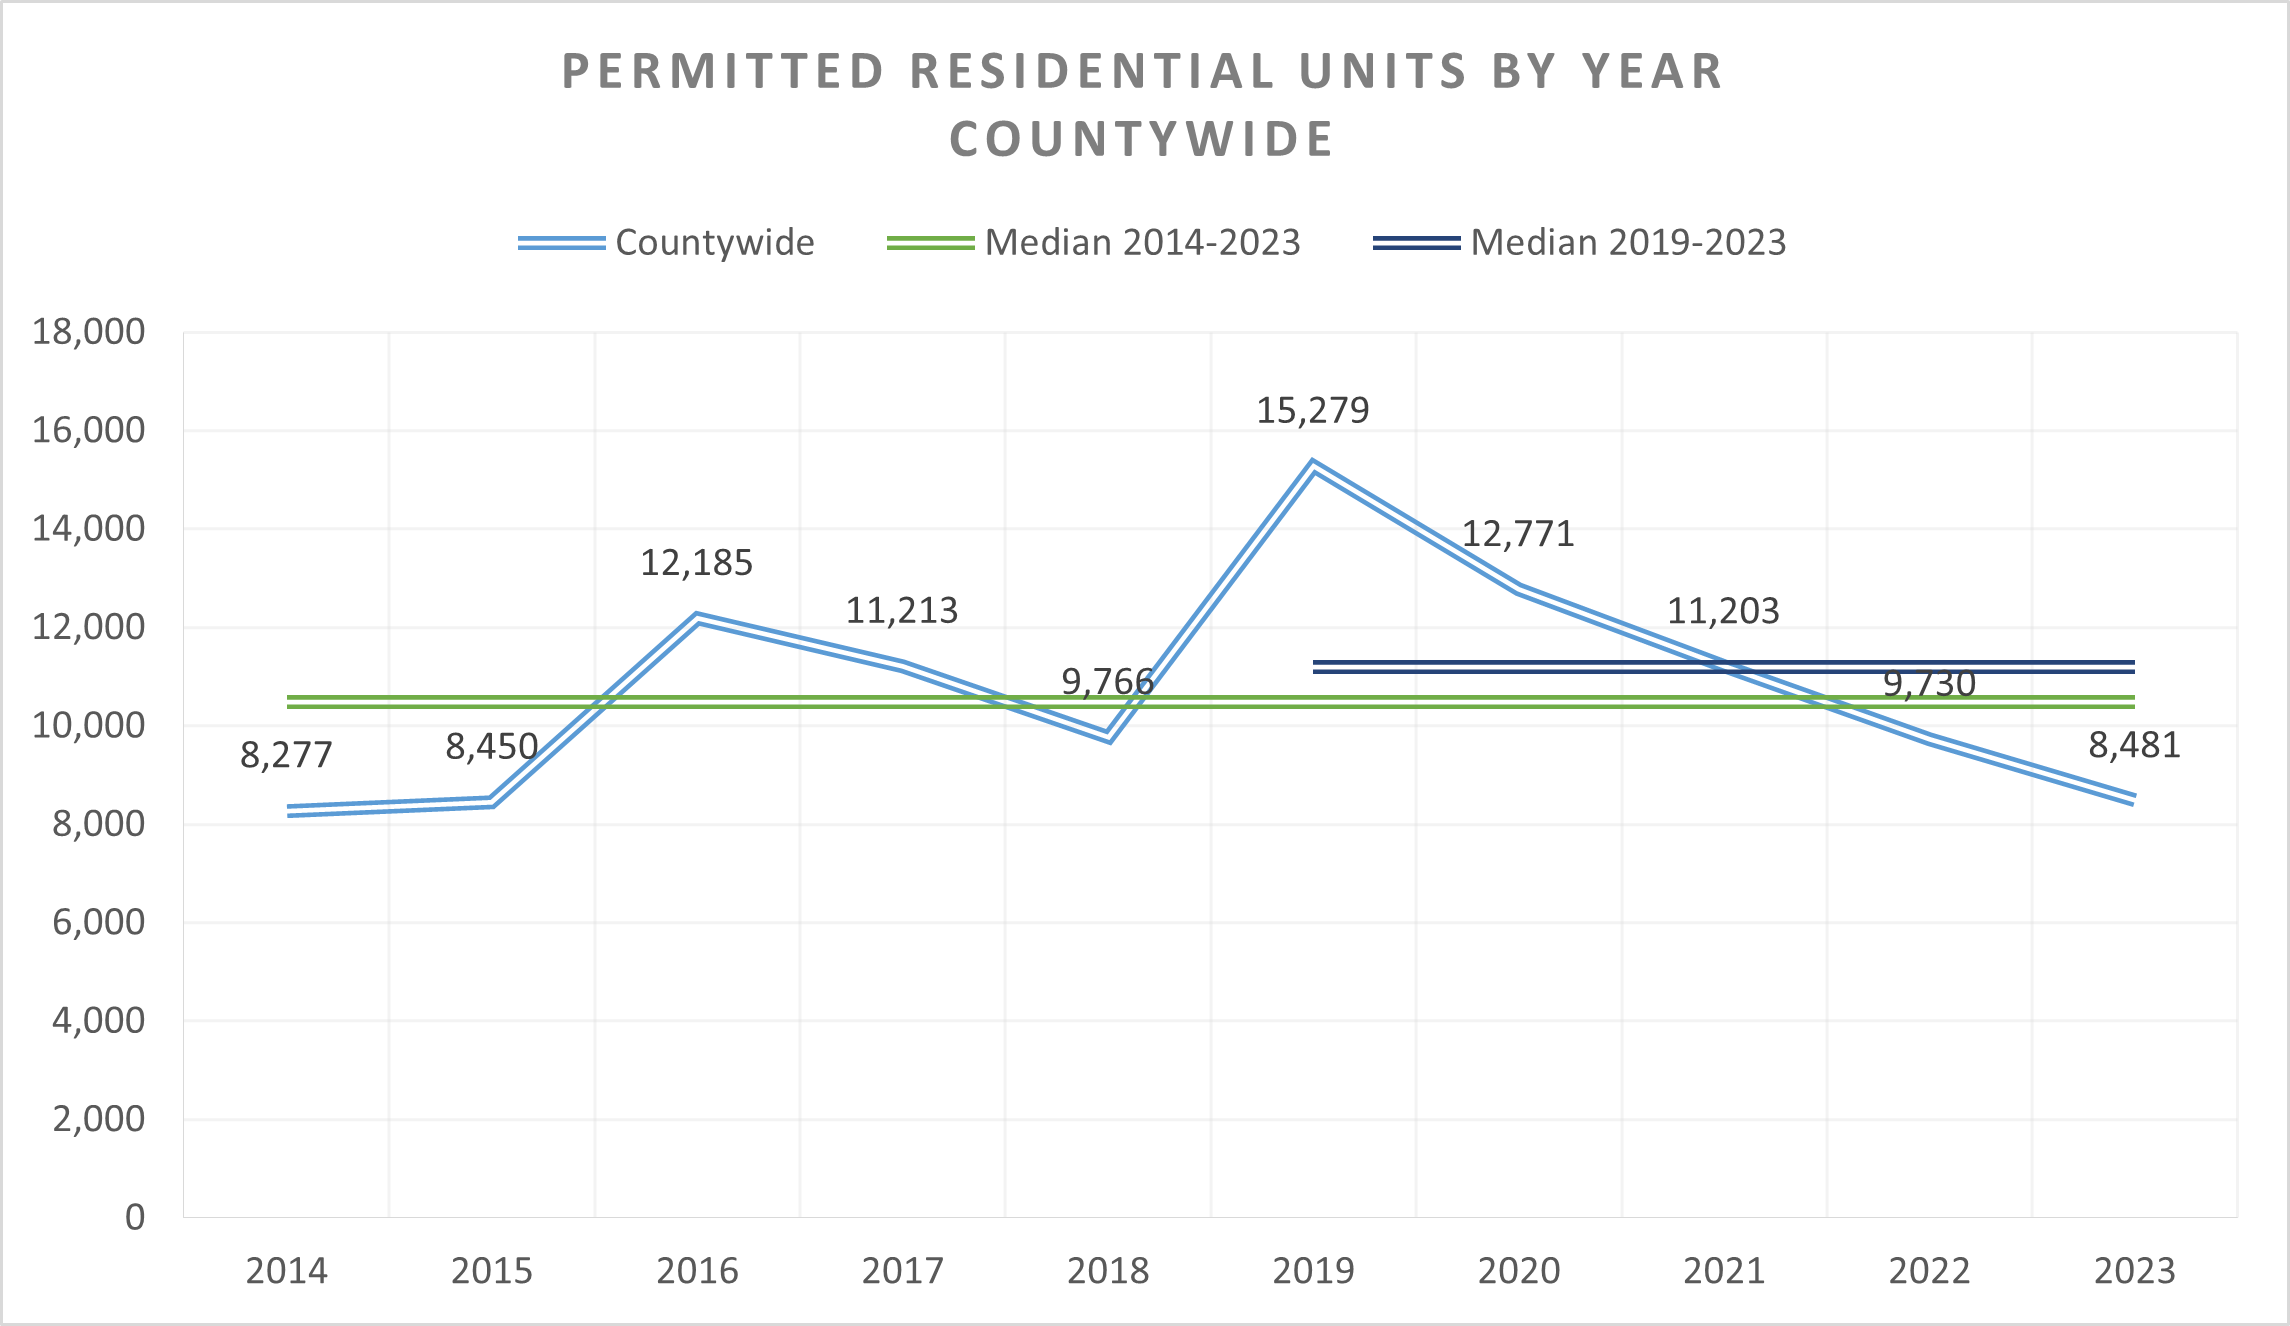
Figure 2a. Permitted Residential Units by Year – Countywide
Figure 2a shows that in the last 10 years (2014-2023), the number of residential units permitted countywide ranged from 8,277 (2014) to 15,279 (2019). Median permitted residential units were 10,485 (in years 2014-2023) and 11,203 (in years 2019-2023). The chart shows a persistent downward trend starting in 2019. Interestingly, the number of permits issued in 2023 is only slightly higher than the number of permits issued in 2014. In 2023, permitted residential units were 44% lower from their peak in 2019.
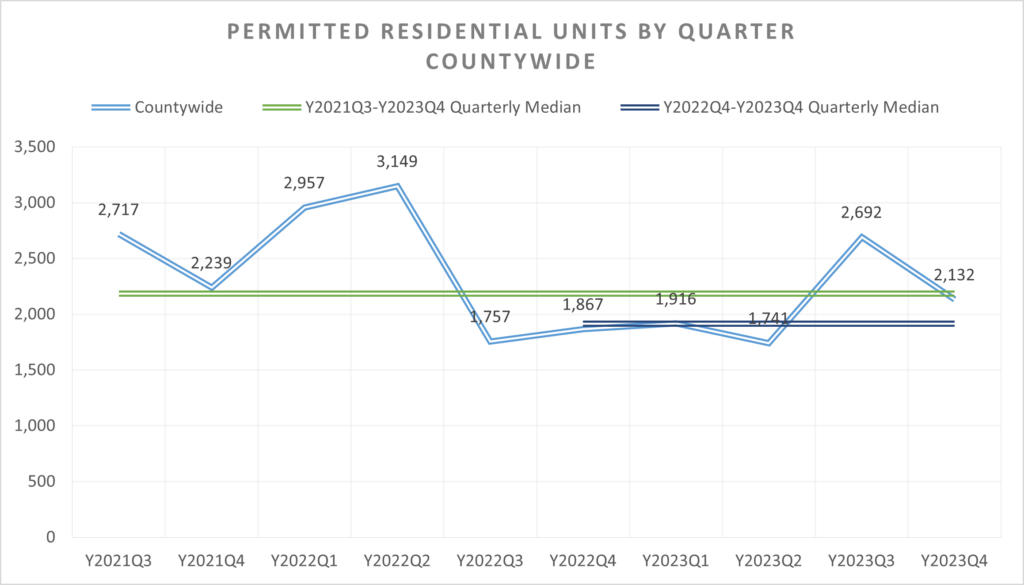
Figure 2b. Permitted Residential Units by Quarter – Countywide
Figure 2b shows that in the last 10 quarters (July-September 2021 through October-December 2023), the number of residential units permitted countywide ranged from 1,741 (April-June 2023) to 3,149 (April-June 2022). Median permitted residential units were 2,186 (July-September 2021 to October-December 2023) and 1,916 (October-December 2022 through October-December 2023). The chart shows that permitted residential units have been mostly below the median since July-September 2022. In October-December 2023 (Y2023Q4), permitted residential units were 14% higher than October-December 2022 (Y2022Q4).
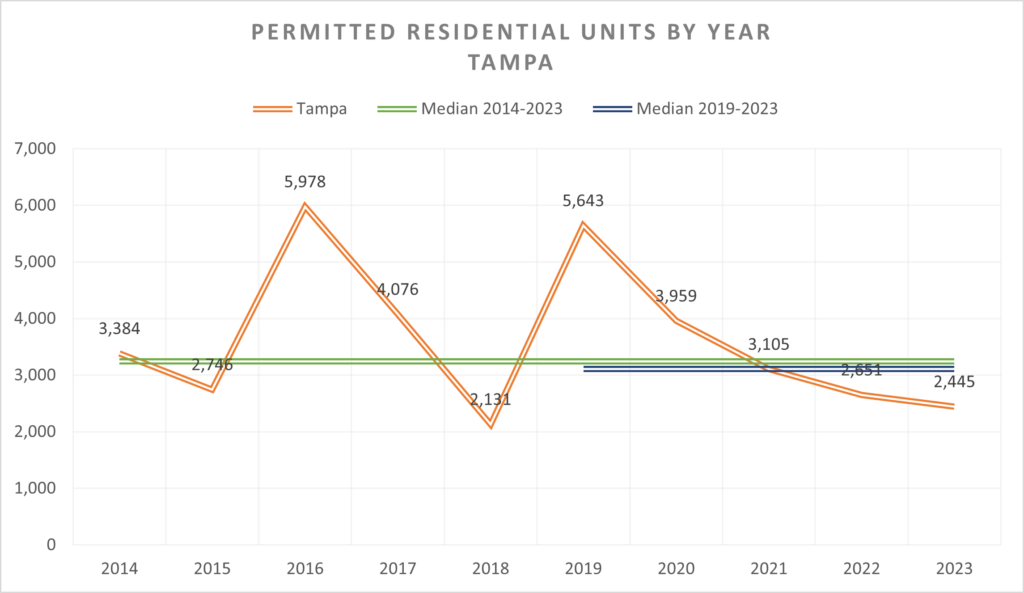
Figure 3a. Permitted Residential Units by Year – Tampa
Figure 3a shows that in the last 10 years (2014-2023), the number of residential units permitted in Tampa have ranged from 2,131 (2018) to 5,978 (2016). Median permitted residential units were 3,245 (in years 2014-2023) and 3,105 (in years 2019-2023). The chart shows that permitted residential units have been trending down since 2019. In 2023, permitted residential units were 57% lower than in 2019.
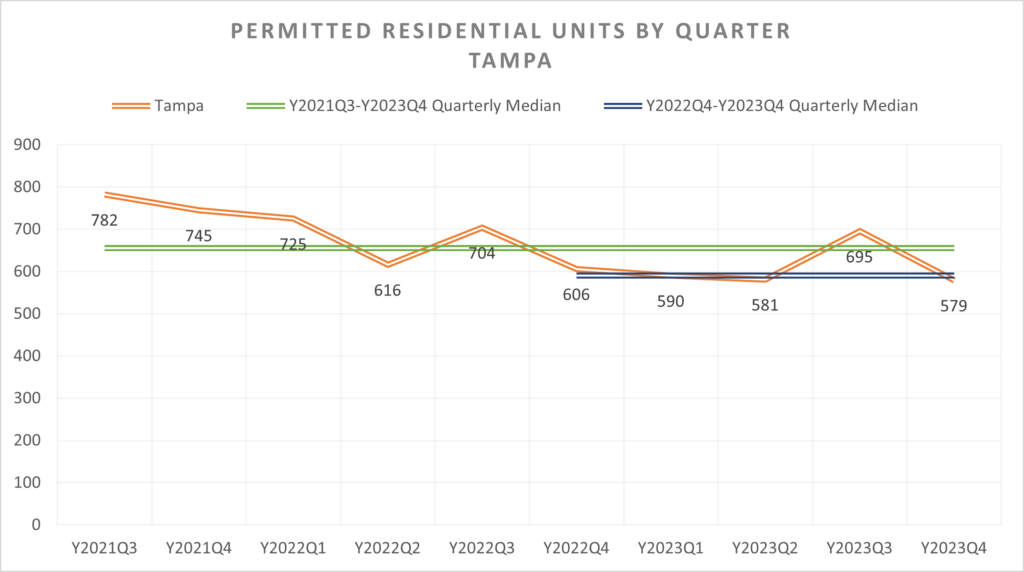
Figure 3b. Permitted Residential Units by Quarter – Tampa
Figure 3b shows that in the last 10 quarters (July-September 2021 through October-December 2023), the number of residential units permitted in Tampa ranged from 579 (October-December 2023) to 782 (July-September 2021). Median permitted residential units were 656 (July-September 2021 to October-December 2023) and 590 (October-December 2022 through October-December 2023). Generally, the chart shows that permitted residential units have been trending down. In October-December 2023 (Y2023Q4), permitted residential units were 4% lower than October-December 2022 (Y2022Q4).
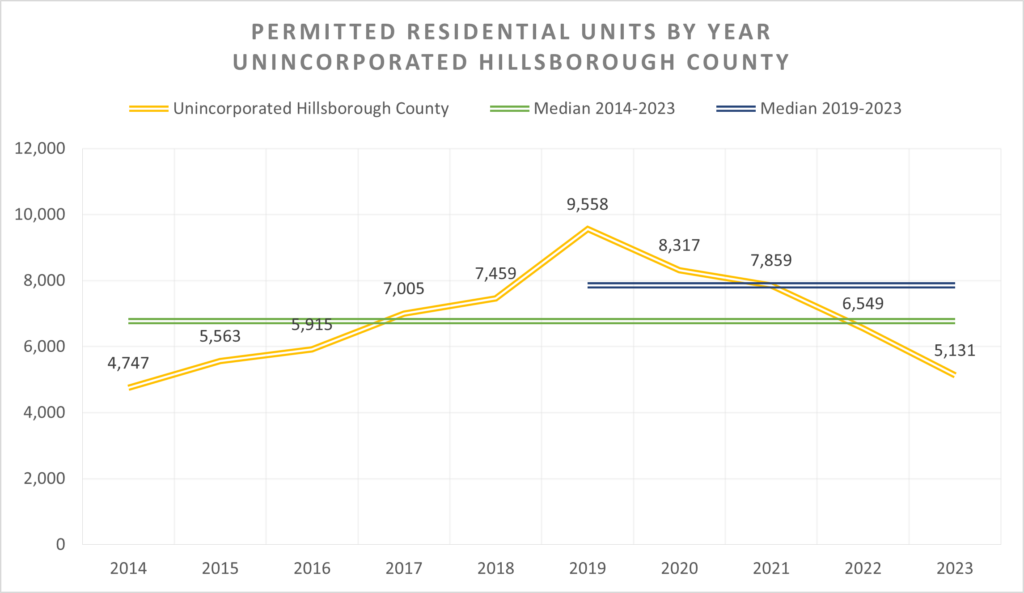
Figure 4a. Permitted Residential Units by Year – Unincorporated Hillsborough County
Figure 4a shows that in the last 10 years (2014-2023), the number of residential units permitted in Unincorporated Hillsborough County have ranged from 4,747 (in 2014) to 9,558 (2019). Median permitted residential units were 6,777 (in years 2014-2023) and 7,859 (in years 2019-2023). The chart shows that permitted residential units peaked in 2019. More recently, permitted residential units in 2023 were lower than permitted residential units in 2015. In 2023, permitted residential units were 46% lower than their 2019 peak.
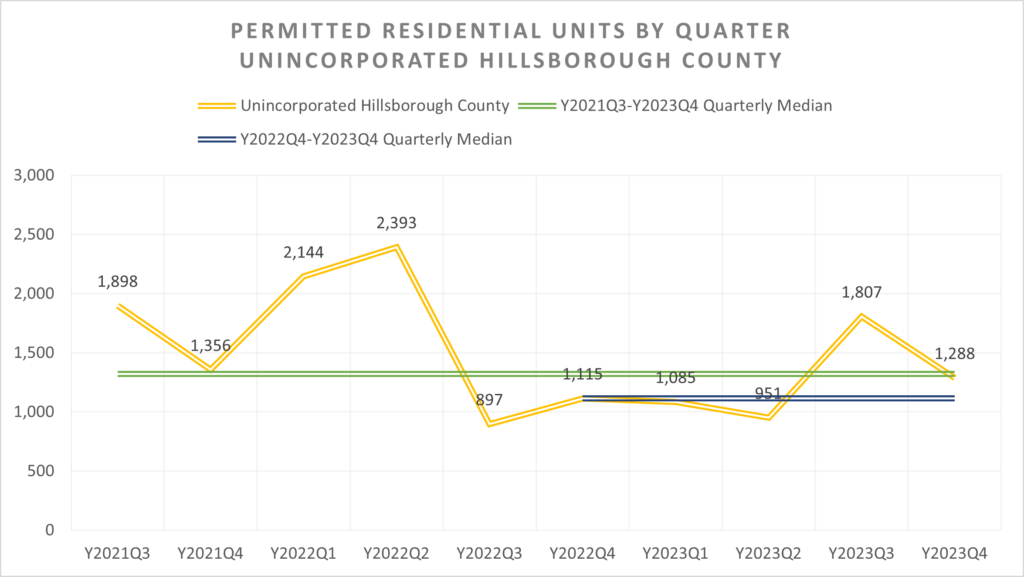
Figure 4b. Permitted Residential Units by Quarter – Unincorporated Hillsborough County
Figure 4b shows that in the last 10 quarters (July-September 2021 through October-December 2023), the number of residential units permitted in Tampa ranged from 897 (July-September 2022) to 2,393 (April-June 2022). Median permitted residential units were 1,322 (July-September 2021 to October-December 2023) and 1,115 (October-December 2022 through October-December 2023). The chart shows that permitted residential units have been trending down since April-June 2022. In October-December 2023 (Y2023Q4), permitted residential units were 16% higher than October-December 2022 (Y2022Q4).
Nonresidential Permits
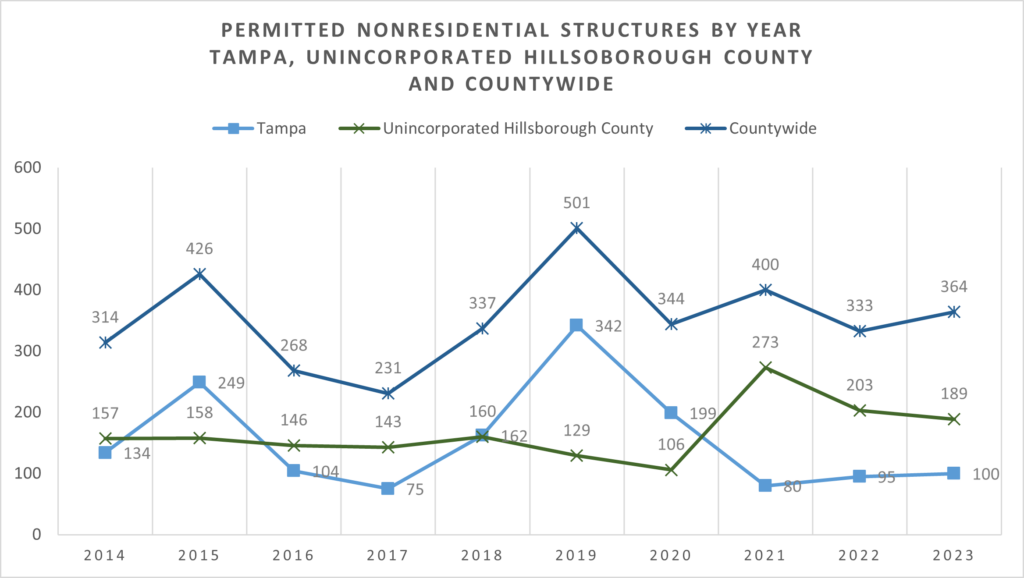
Figure 5. Permitted Nonresidential Units in 2023 – Tampa, Unincorporated Hillsborough County & Countywide
Figure 5 shows that in the last 10 years (2014-2023), the number of nonresidential structures permitted in Tampa peaked in 2015 and 2019. They have declined 71% since 2019. For Unincorporated Hillsborough County, permitted nonresidential structures have been highest in the years 2021 to 2023. Countywide, permitted residential units peaked in 2015, 2019, 2021, and 2023.
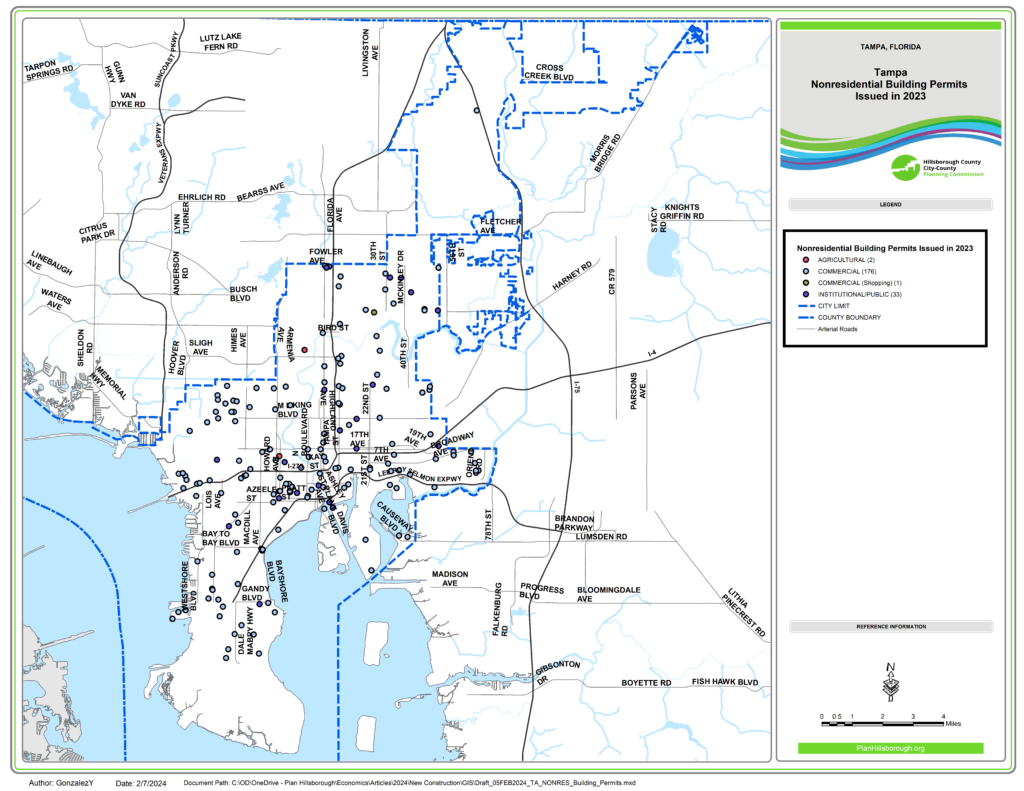
Map 3. Permitted Nonresidential Units in 2023 – Tampa
Map 3 shows 2023 nonresidential building permits issued in Tampa. Most of these permits were for commercial establishments (176).
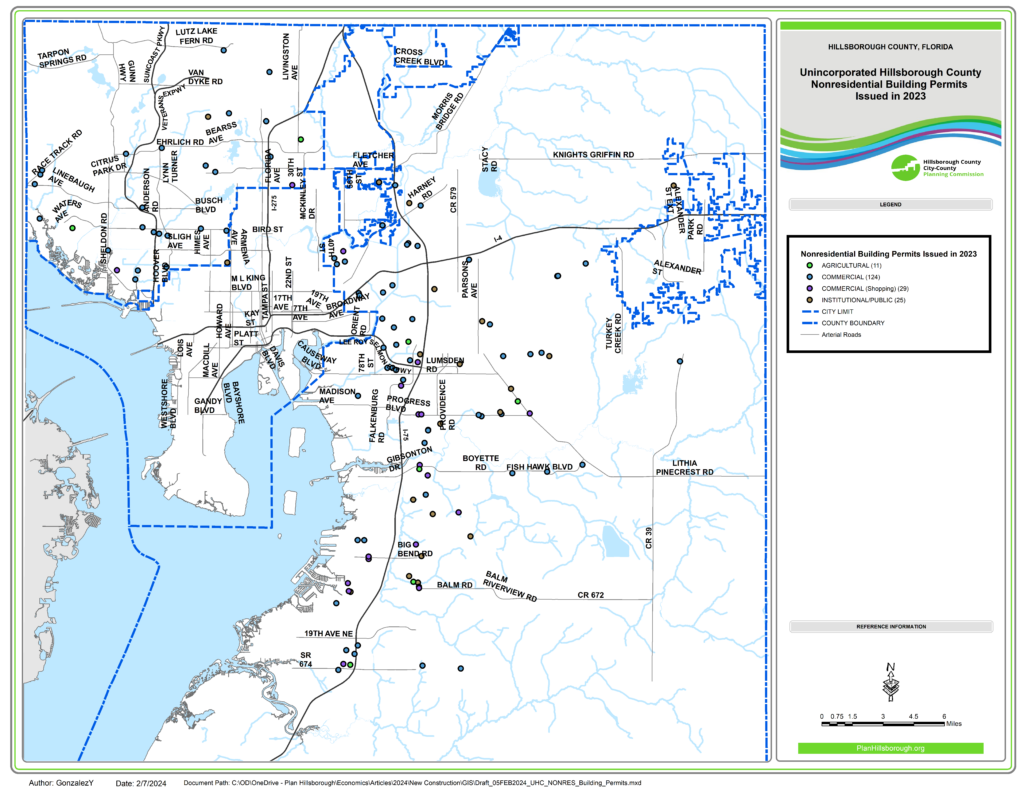
Map 4. Permitted Nonresidential Units in 2023 – Unincorporated Hillsborough County
Map 4 shows 2023 nonresidential building permits issued in Unincorporated Hillsborough County. Most of these permits were for commercial establishments (153) and Institutional/Public (25).
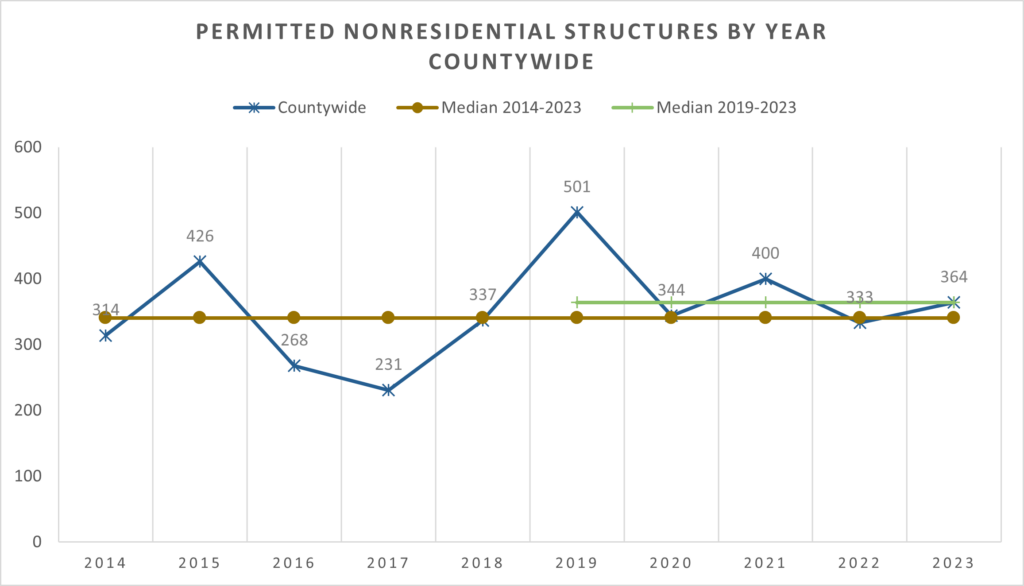
Figure 6a. Permitted Noneresidential Units by Year – Countywide
Figure 6a shows that in the last 10 years (2014-2023), the number of nonresidential structures permitted countywide ranged from 231 (2017) to 501 (2019). Median permitted nonresidential structures were 341 (in years 2014-2023) and 364 (in years 2019-2023). In 2023, permitted nonresidential structures were 27% lower than their 2019 peak.
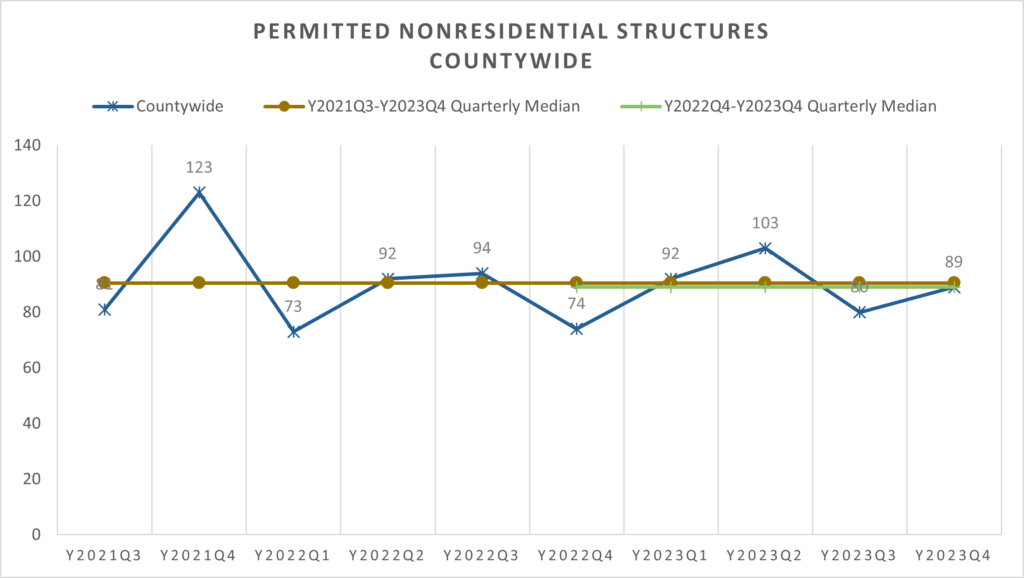
Figure 6b. Permitted Nonresidential Units by Quater – Countywide
Figure 6b shows that in the last 10 quarters (July-September 2021 through October-December 2023), the number of nonresidential structures permitted countywide ranged from 73 (January-March 2022) to 123 (October-December 2022). Median permitted nonresidential structures were 91 (July-September 2021 to October-December 2023) and 89 (October-December 2022 to October-December 2023). Generally, the chart shows that permitted nonresidential structures have been tracking the medians since January-March 2022. In October-December 2023 (Y2023Q4), permitted nonresidential structures were 20% higher than October-December 2022 (Y2022Q4).
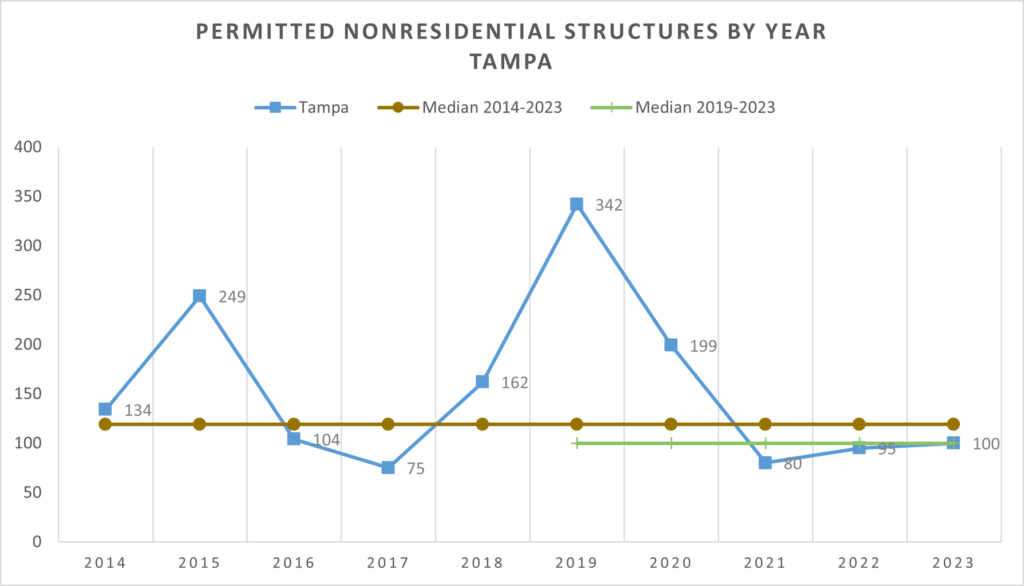
Figure 7a. Permitted Nonresidential Units by Year – Tampa
Figure 7a shows that in the last 10 years (2014-2023), the number of nonresidential structures permitted in Tampa ranged from 75 (2017) to 342 (2019). Median permitted nonresidential structures were 119 (in years 2014-2023) and 100 (in years 2019-2023). The chart shows a downward trend since 2019. Permitted nonresidential structures were below both medians from 2021 through 2023. In 2023, permitted nonresidential structures were 71% lower than their 2019 peak.
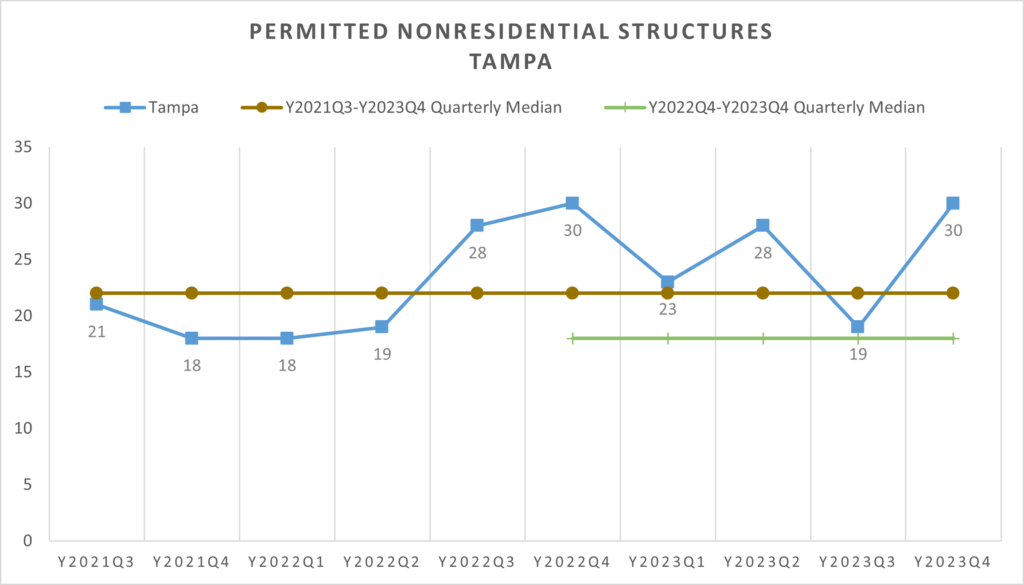
Figure 7b. Permitted Noneresidential Units by Quater – Tampa
Figure 7b shows that in the last 10 quarters (July-September 2021 through October-December 2023), the number of nonresidential structures permitted in Tampa ranged from 18 (January-March 2022) to 30 (October-December 2023). Median permitted nonresidential structures were 22 (July-September 2021 to October-December 2023) and 28 (October-December 2022 to October-December 2023). The chart shows that permitted nonresidential structures exceeded the median in 4 of the last 5 quarters. In October-December 2023 (Y2023Q4), permitted nonresidential structures were the same as in October-December 2022 (Y2022Q4).
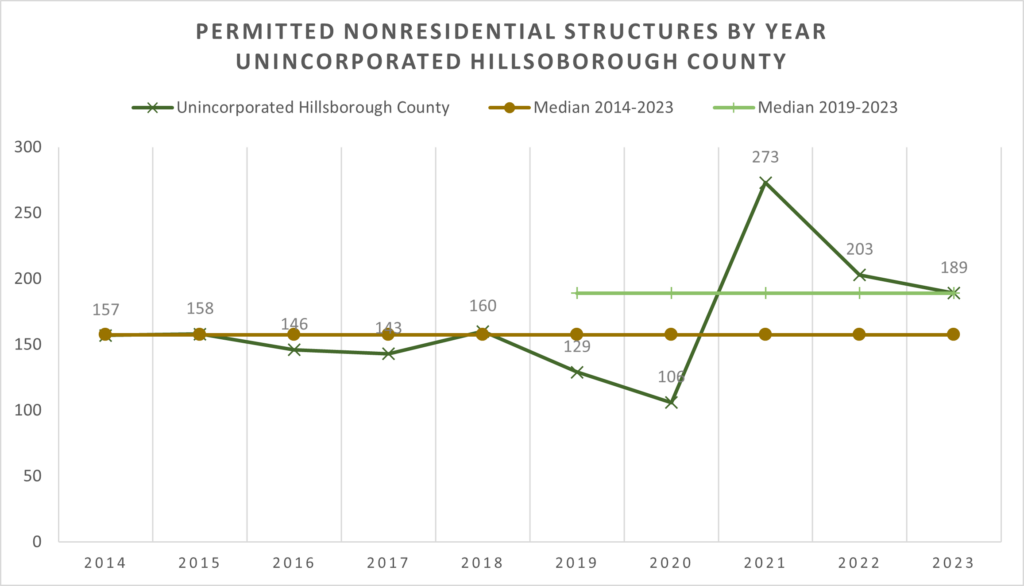
Figure 8a. Permitted Noneresidential Units by Year – Unincorporated Hillsborough County
Figure 8a shows that in the last 10 years (2014-2023), the number of nonresidential structures permitted in Temple Terrace ranged from 106 (2020) to 273 (2021). Median permitted nonresidential structures were 158 (in years 2014-2023) and 189 (in years 2019-2023). Permitted nonresidential structures have been highest since 2021. In 2023, permitted nonresidential structures were 47% higher than in 2019.
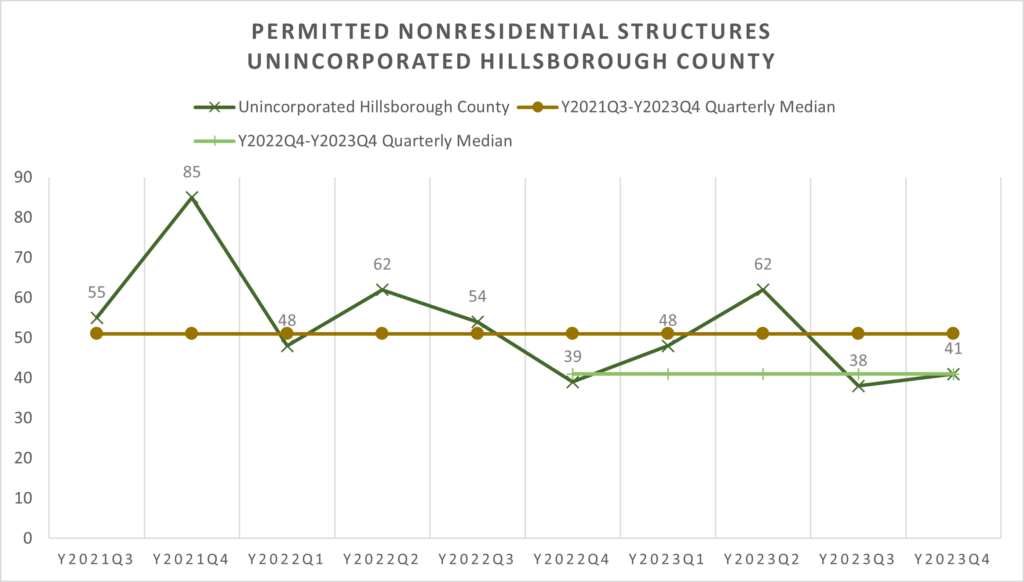
Figure 8b. Permitted Noneresidential Units by Quater – Unincorporated Hillsborugh County
Figure 8b shows that in the last 10 quarters (July-September 2021 through October-December 2023), the number of nonresidential structures permitted in Unincorporated Hillsborough County ranged from 38 (July-September 2023) to 85 (October-December 2021). Median permitted nonresidential structures were 91 (July-September 2021 to October-December 2023) and 89 (October-December 2022 to October-December 2023). Generally, the chart shows that permitted nonresidential structures have been trending down since January-March 2022. More specifically, permitted nonresidential structures decreased considerably in the second half of 2023. In October-December 2023 (Y2023Q4), permitted nonresidential structures were 5% higher than October-December 2022 (Y2022Q4).
To conclude, countywide, residential building permits have been trending lower since 2019. In relation to their 2019, permitted residential units are significantly down. In Tampa, UHC, and Countywide, they are are 57%, 46%, and 45% lower, respectively. For permitted nonresidential structures, UHC has issued 47% more nonresidential building permits since 2019. Meanwhile, Tampa and Countywide are 71% and 27% down, respectively.
[i] Fernandez, Jose. Subject: Subject: RE: Why significant and persistent decline in building permits issue since 2019? Email to Yassert Gonzalez. January 29, 2024.
[ii] Ngo, Long. Subject: RE: Why significant and persistent decline in building permits issue since 2019? Email to Yassert Gonzalez. February 1, 2024.
[iii] Wolf, Ali and Buckner, Larry. Economist and Advisory Manager with Zonda. Presentation to Tampa Bay Builders Association. Armature Works. Tampa. January 10, 2024.