In 2023, Plant City and Temple Terrace issued most residential permits since 2021
Published March 1, 2024
Contact Yassert A. Gonzalez
Manager – Economics, Demographics & Research
813-582-7356 (o)
[email protected]
planhillsborough.org
Last updated March 13, 2024
This is the second part of two blogs on building permits trends in the period 2014-2023 (See previous blog here.). As a reminder, Planning Commission staff have built several dashboards that allow decision makers and the public to review building permits issued throughout the county. As before, we will be looking at residential and commercial building permits in Plant City and Temple Terrace issued in the last ten years (2014-2023) and the last 10 quarters (i.e., July-September 2021 to October-December 2023). As we will see, for these two municipalities, building permits have been trending up for several years. Alternatively, as recounted in our previous blog post, Tampa and Unincorporated Hillsborough County (UHC) have been issuing less permits every year since 2019. For building permit numbers and visual details, see the charts below.
Residential Permits
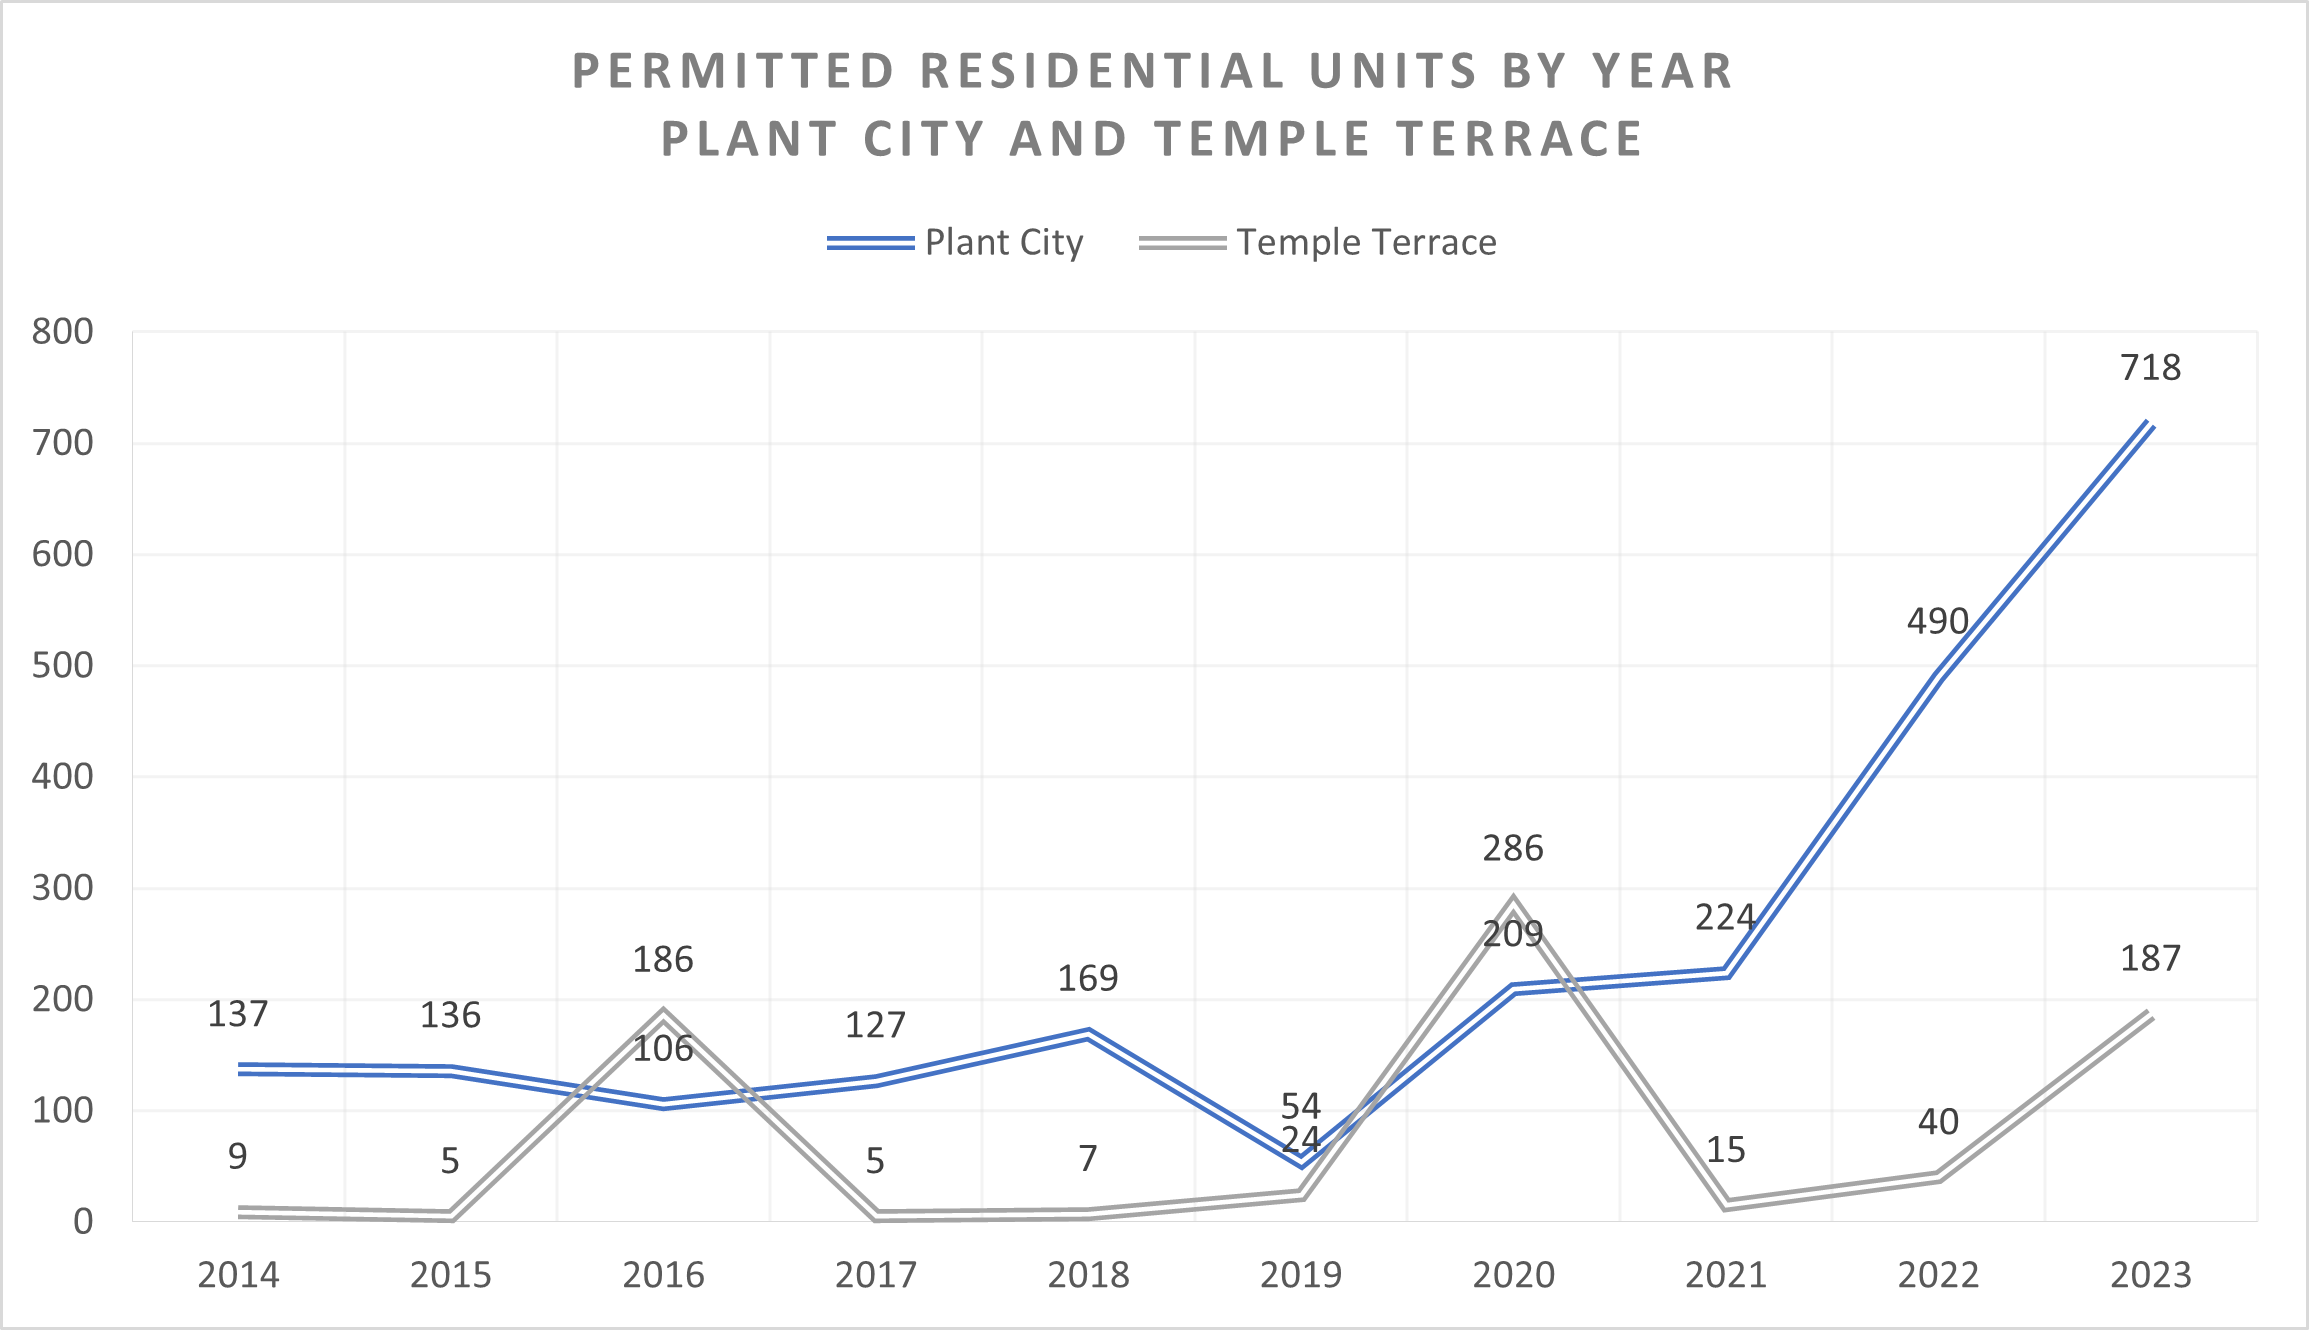
Figure 1. Permitted Residential Units by Year – Plant City and Temple Terrace
Figure 1 shows that in the last 10 years (2014-2023), permitted residential units in Plant City have increased dramatically since 2019. For Temple Terrace, permitted residential units peaked in 2016, 2020 and 2023.
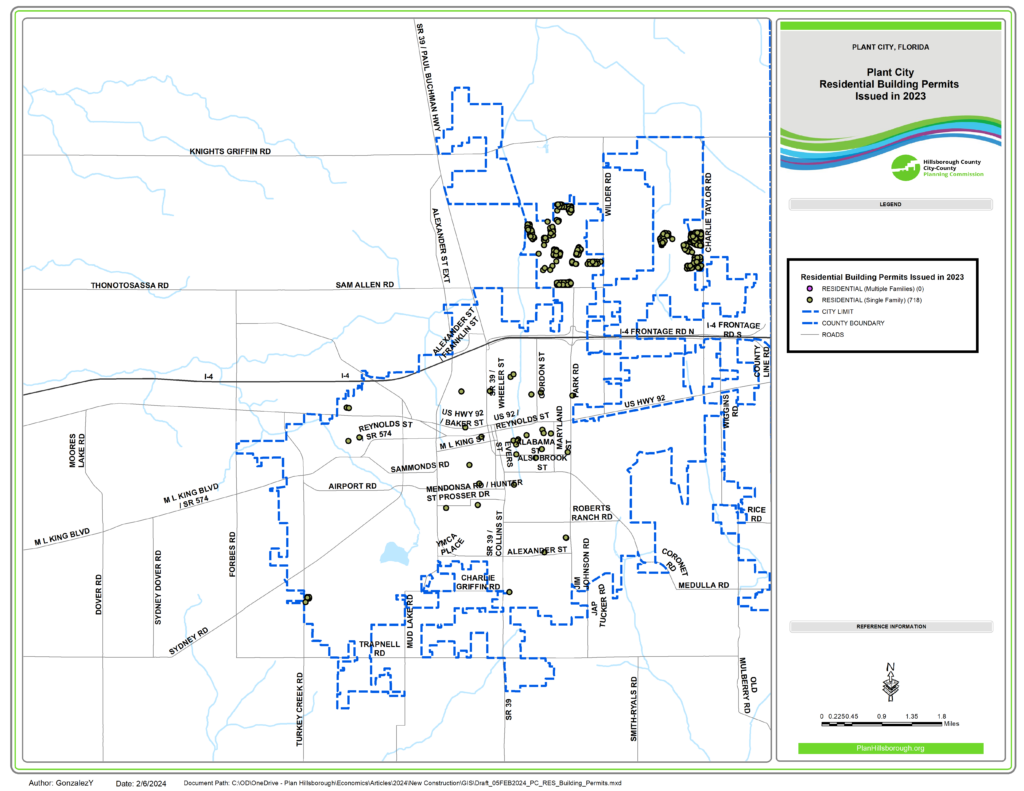
Map 1. Permitted Residential Units in 2023 – Plant City
Map 1 shows 2023 residential building permits issued in Plant City. Most of these permits were issued in Northeast Plant City. There were 718 building permits for single family homes.
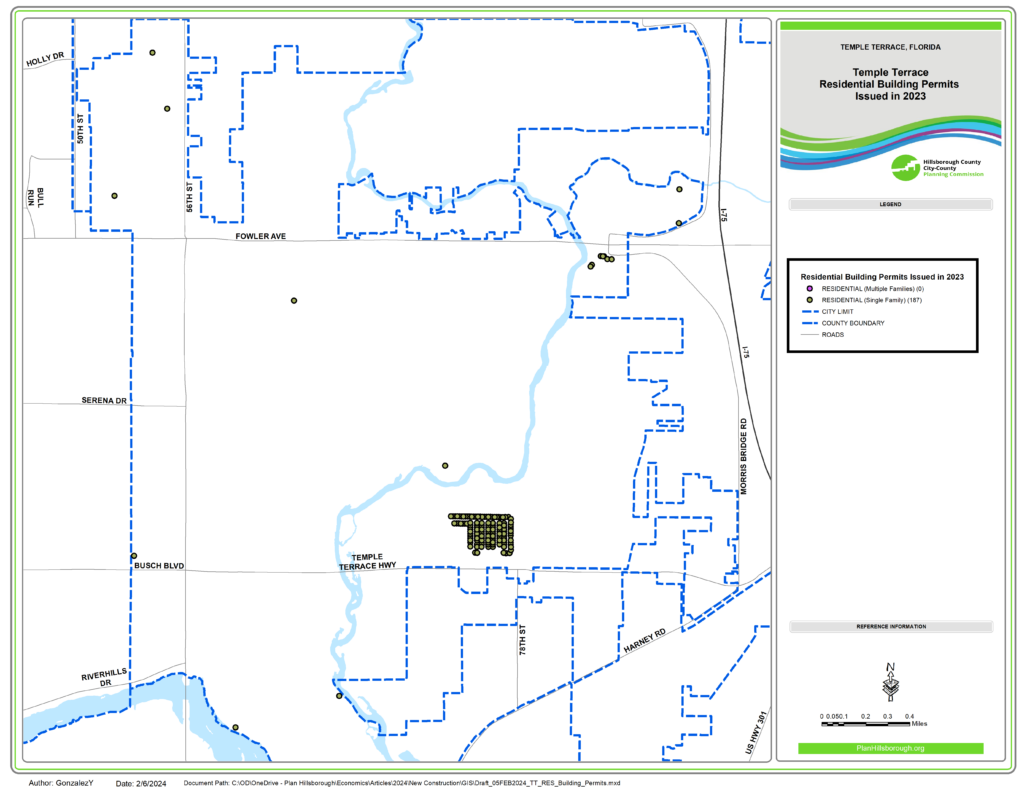
Map 2. Permitted Residential Units in 2023 – Temple Terrace
Map 2 shows 2023 residential building permits issued in Temple Terrace. Most of these permits were issued in the River Park development. There were 187 building permits for single family homes.
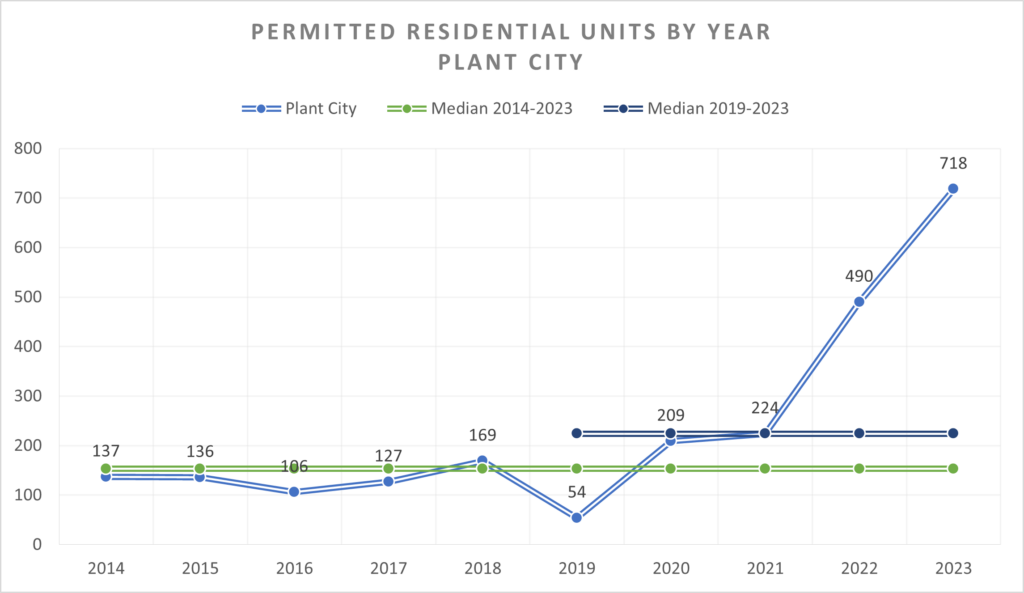
Figure 2a. Permitted Residential Units by Year – Plant City
Figure 2a shows that in the last 10 years (2014-2023), the number of residential units permitted in Plant City have ranged from 54 (2019) to 718 (2023). Median permitted residential units were 153 (in years 2014-2023) and 224 (in years 2019-2023). The chart shows that permitted residential units have been setting new highs since 2019. In 2023, permitted residential units were the highest since 2014 (+424%).
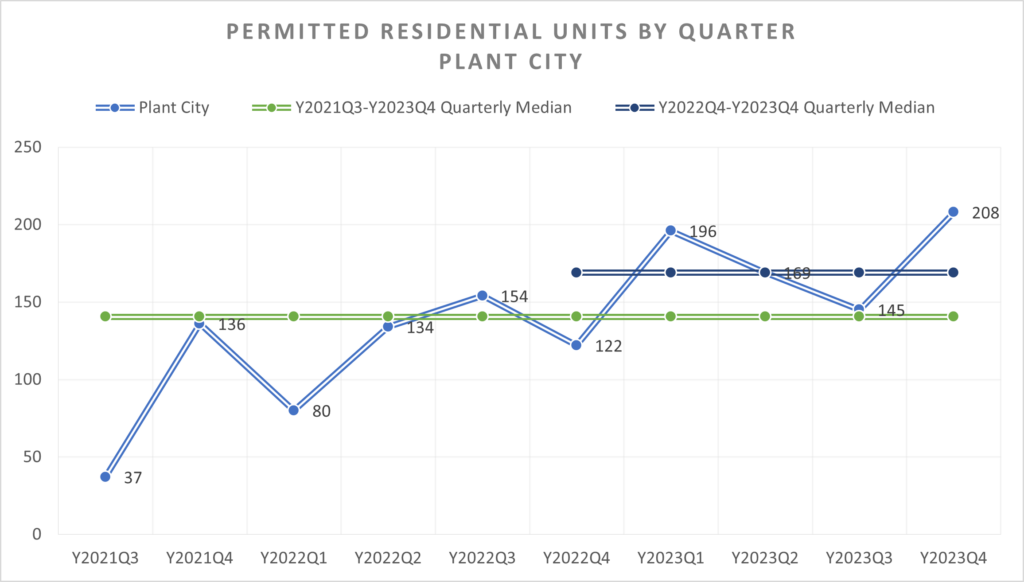
Figure 2b. Permitted Residential Units by Quarter – Plant City
Figure 2b shows that in the last 10 quarters (July-September 2021 through October-December 2023), the number of residential units permitted in Plant City ranged from 37 (July-September 2021) to 208 (October-December 2023). Median permitted residential units were 141 (July-September 2021 to October-December 2023) and 169 (October-December 2022 through October-December 2023). The chart shows that permitted residential units have been trending up. In October-December 2023 (Y2023Q4), permitted residential units were 70% higher than October-December 2022 (Y2022Q4).
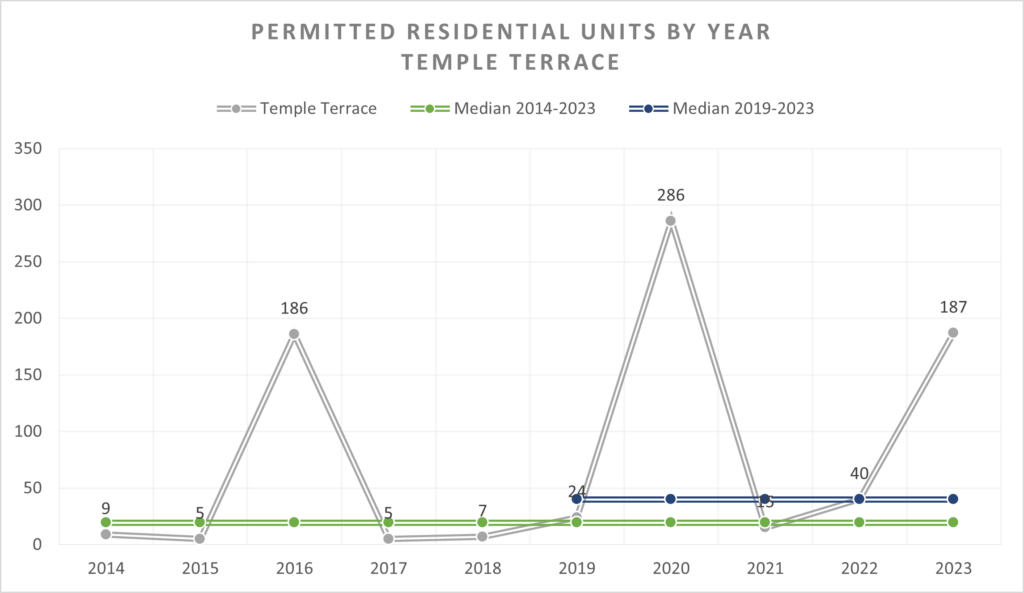
Figure 3a. Permitted Residential Units by Year – Temple Terrace
Figure 3a shows that in the last 10 years (2014-2023), the number of residential units permitted in Temple Terrace have ranged from 5 (in 2015 and 2017) to 286 (2020). Median permitted residential units were 20 (in years 2014-2023) and 40 (in years 2019-2023). The chart shows that permitted residential units peaked in 2016 (186 permitted residences), 2020 (286 permitted residences), and 2023 (187 permitted residences). More recently, permitted residential units have been trending up since 2021. In 2023, permitted residential units were the highest since 2021 (+679%).
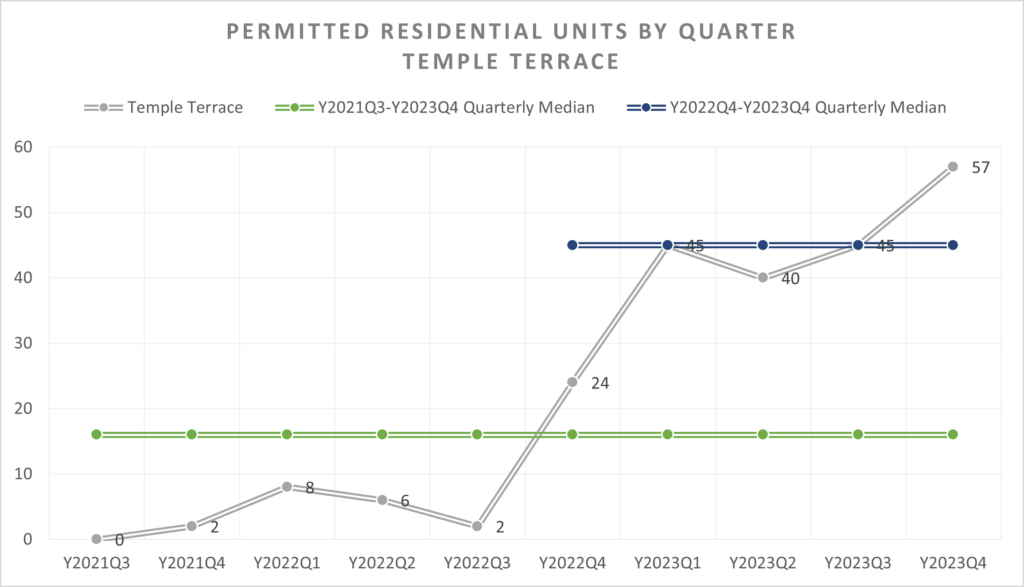
Figure 3b. Permitted Residential Units by Quarter – Temple Terrace
Figure 3b shows that in the last 10 quarters (July-September 2021 through October-December 2023), the number of residential units permitted in Tampa ranged from 0 (October-December 2021) to 57 (October-December 2023). Median permitted residential units were 16 (July-September 2021 to October-December 2023) and 45 (October-December 2022 through October-December 2023). The chart shows that permitted residential units have been trending up since October-December 2022. In October-December 2023 (Y2023Q4), permitted residential units were 178% higher than October-December 2022 (Y2022Q4).
Nonresidential Permits
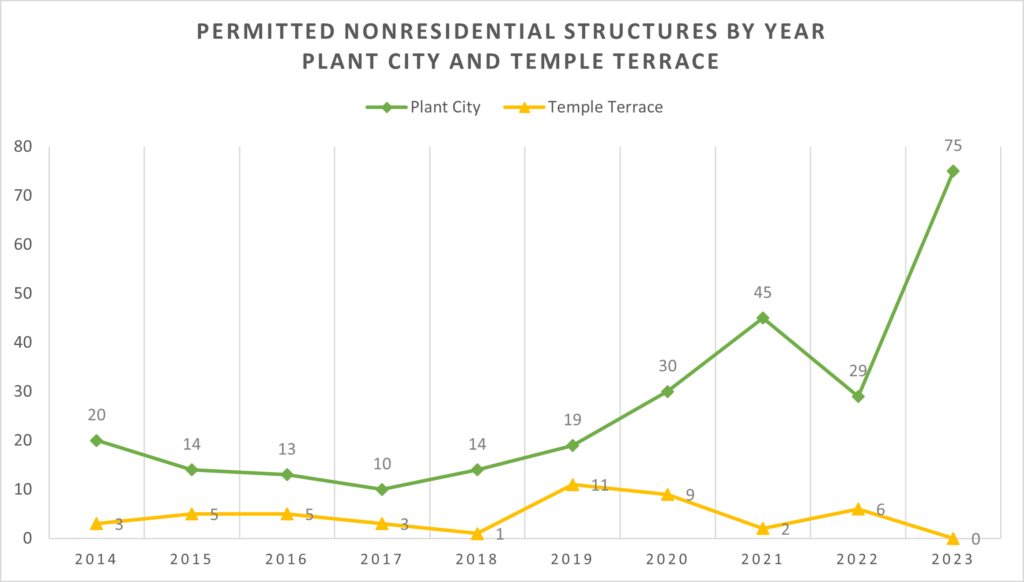
Figure 5. Permitted Nonresidential Units by Year – Plant City
Figure 5 shows that in the last 10 years (2014-2023), permitted nonresidential structures in Plant City have increased dramatically since 2019. For Temple Terrace, permitted nonresidential structures peaked in 2016, 2019 and 2022. In 2023, there were no nonresidential structures permitted. In 2023, permitted nonresidential structures were the highest since 2014 (+275%).
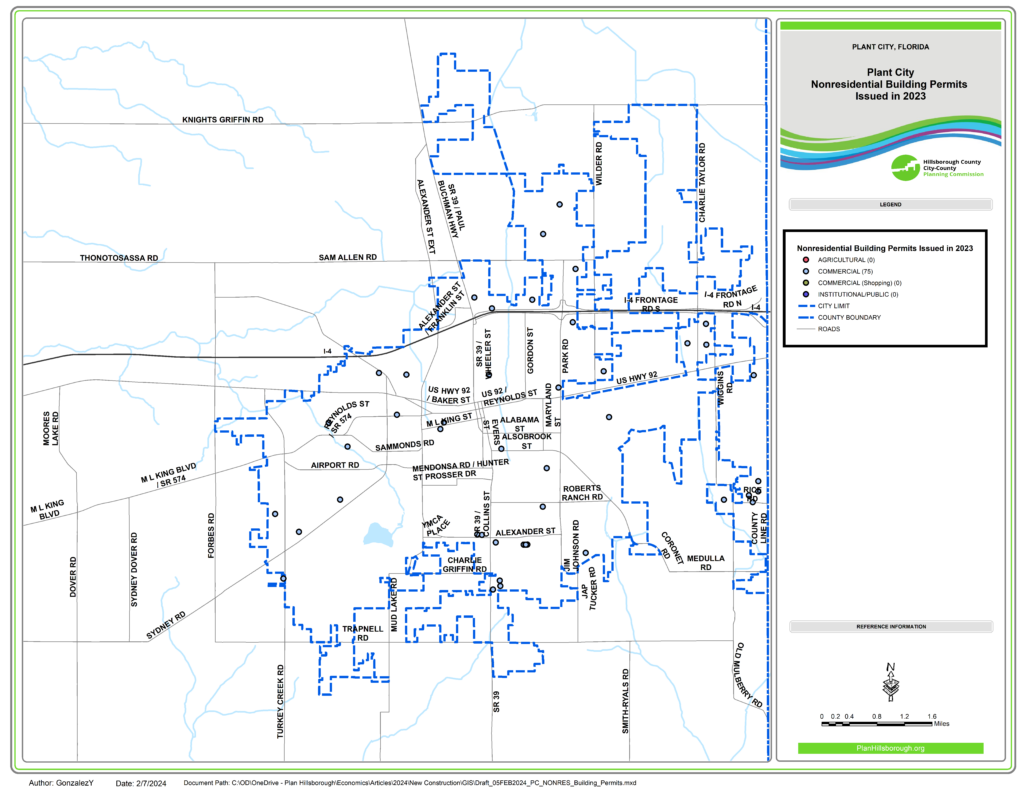
Map 3. Permitted Nonresidential Units in 2023 – Plant City
Map 4 shows 2023 nonresidential building permits issued in Plant City. Most of these permits were commercial (75).
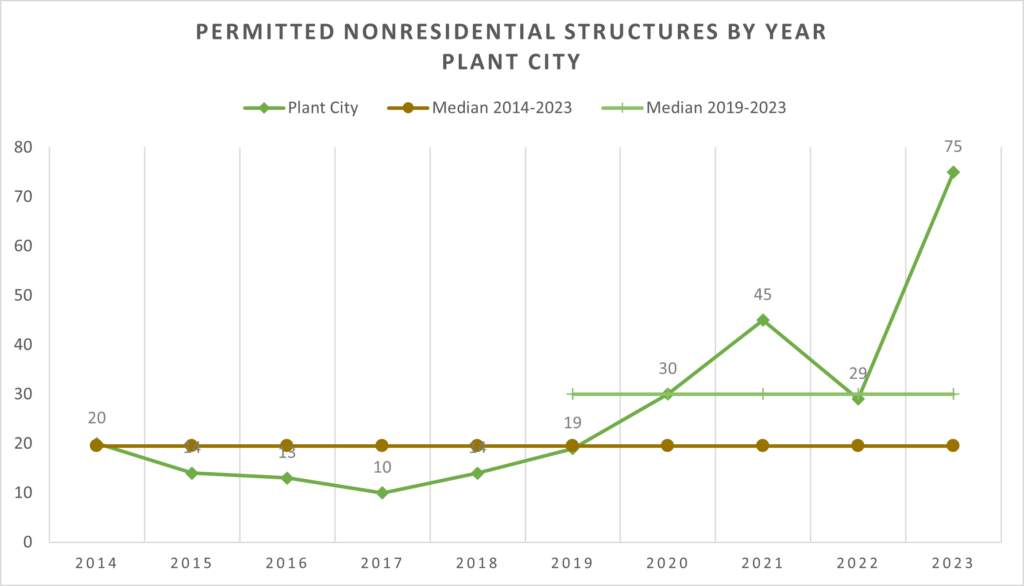
Figure 6a. Permitted Noneresidential Units by Year – Plant City
Figure 6a shows that in the last 10 years (2014-2023), the number of nonresidential structures permitted in Plant City ranged from 10 (2017) to 75 (2023). Median permitted nonresidential structures were 20 (in years 2014-2023) and 30 (in years 2019-2023). The chart shows a pronounced upward trend. Permitted nonresidential structures in 2023 were the highest since 2014.
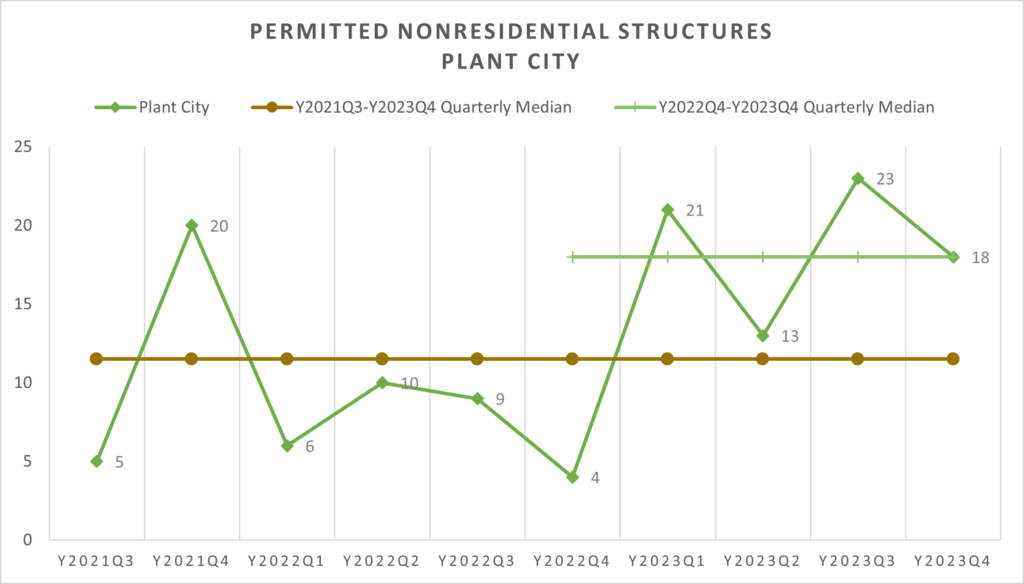
Figure 6b. Permitted Nonresidential Units by Quater – Plant City
Figure 6b shows that in the last 10 quarters (July-September 2021 through October-December 2023), the number of nonresidential structures permitted countywide ranged from 4 (October-December 2022) to 18 (October-December 2023). Median permitted nonresidential structures were 12 (July-September 2021 to October-December 2023) and 18 (October-December 2022 to October-December 2023). Generally, the chart shows that permitted nonresidential structures have been trending up since January-March 2023. In October-December 2023 (Y2023Q4), permitted nonresidential structures were 350% higher than October-December 2022 (Y2022Q4).
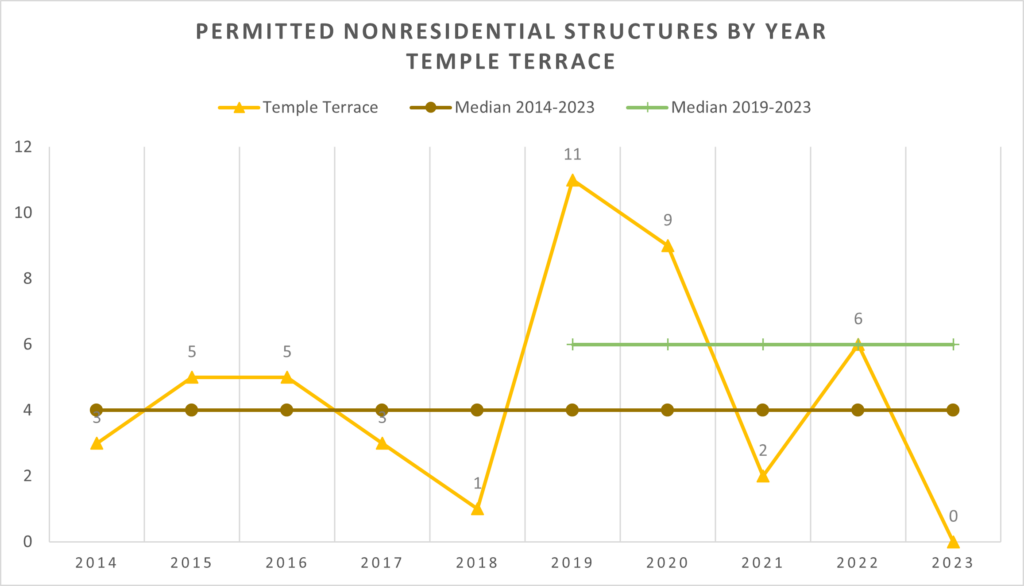
Figure 7a. Permitted Noneresidential Units by Year – Temple Terrace
Figure 7a shows that in the last 10 years (2014-2023), the number of nonresidential structures permitted in Temple Terrace ranged from 0 (2017) to 11 (2019). Median permitted nonresidential structures were 4 (in years 2014-2023) and 6 (in years 2019-2023). The data swings wildly. There were no permitted nonresidential structures in 2023. In 2023, permitted nonresidential structures have been trending down since their peak in 2019. In 2023, there were no permitted nonresidential structures.
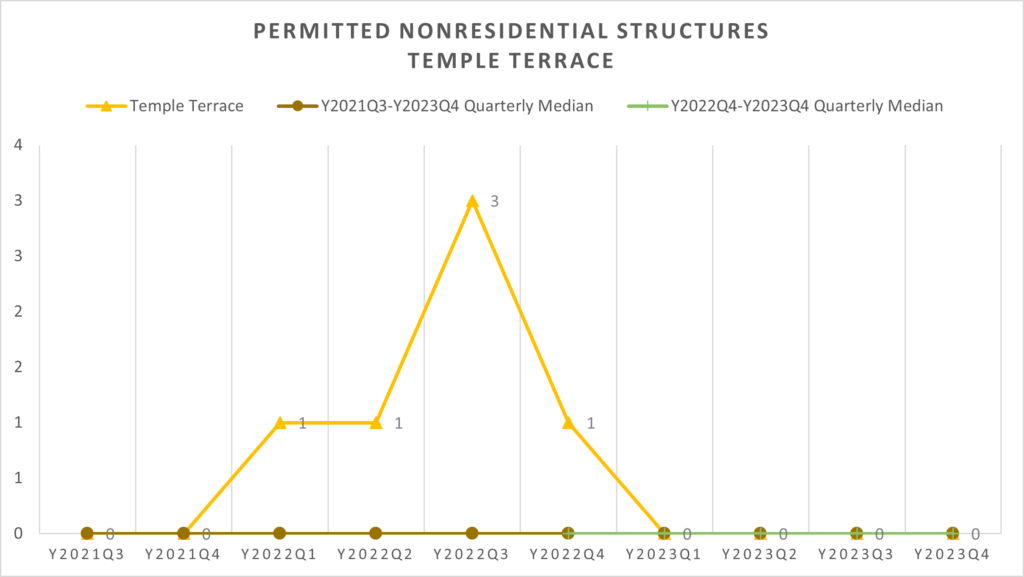
Figure 7b. Permitted Noneresidential Units by Quater – Temple Terrace
Figure 7b shows that in the last 10 quarters (July-September 2021 through October-December 2023), the number of nonresidential structures permitted countywide ranged from 0 (July-September 2021 and five other quarters) to 3 (July-September 2023). Both medians are near zero. The chart shows that there were no permitted residential structures in 2023.
To conclude, in 2023, Plant City and Temple Terrace issued most residential building permits since 2014 and 2021, respetively. More specifically, Plant City’s permitted residential units were 1,230% higher than 2019 (+664 permitted residential units). Similarly, Temple Terrace’s permitted residential units were 679% higher than 2019 (+163 permitted residential units). In terms of permitted noresidential structures, Plant City also issued the most nonresidential permits since 2014. Temple Terrace’s permitted nonresidential structures have been trending down since 2019. There were no nonresidential structures permits issued in 2023.