


Published
March 7, 2023
Contact
Yassert A. Gonzalez | Manager – Economics, Demographics & Research | 813-582-7356 (o) | [email protected] | planhillsborough.org
Last updated
July 17, 2023
Last month, we discussed Adjusted Gross Income (AGI) Inflows into Hillsborough County. In this article, we will be looking at the other side of the proverbial coin. We will examine where how many households leave Hillsborough County and where do they go. Moreover, we would like to know how much Aggregate Gross Income (AGI) [i] leaves with these former residents.
As shown by the tables, charts, and maps, below, more new households (and AGI) move to Hillsborough County than move out. Nonetheless, Hillsborough County ranks 4th (behind Broward, Miami-Dade, and Orange Counties) in terms of lost households and 5th in terms of lost AGI. Moreover, the number of households leaving Hillsborough County has increased slightly since 2017. Not surprisingly, given all this area has to offer, most former Hillsborough County residents are staying in the Tampa Bay Region.
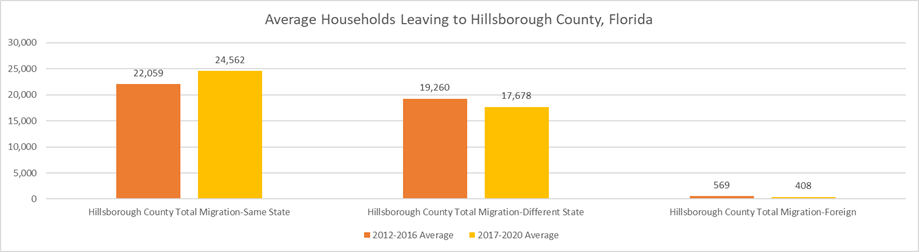
As seen in Chart 1, annually 42,648 households[ii] move from Hillsborough County to other areas. They represent 7% of Hillsborough County’s households. Since 2012, households leaving Hillsborough County have ranged from 25,824 (2015) to 67,143 (2012). Most households leaving Hillsborough County go elsewhere in Florida (~25k households). Chart 2 shows that households leaving Hillsborough County to other parts of Florida have increased 2% since 2017.
Chart 1. Households Leaving Hillsborough County, Florida
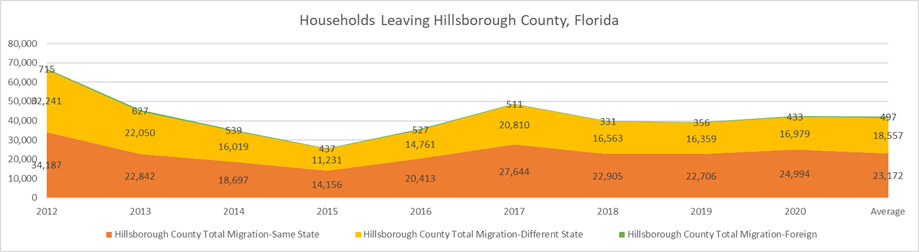
Chart 2. Average Annual Households Leaving Hillsborough County, Florida
As seen in Chart 3, AGI outflows with former Hillsborough County residents ranged from $1.5 billion (2015) to $3.71 billion (2017)[iii]. The largest outflow was reported by folks moving to other Florida counties ($1.56 billion per year). Former residents leaving to other states take with them $1.22 Billion AGI per year. Former Hillsborough residents moving out of the county represent the lowest outflow (around $40 million per year).
Chart 3. Annual AGI Outflows from Hillsborough County, Florida
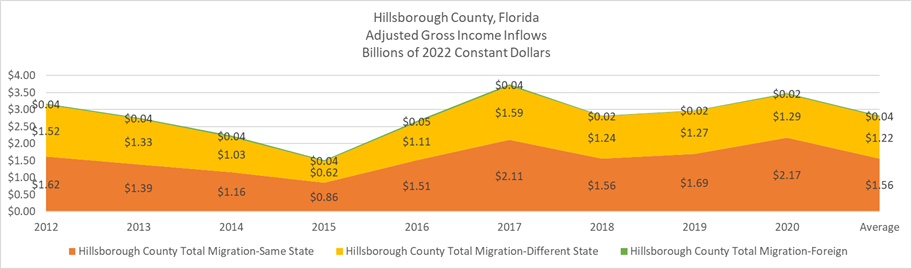
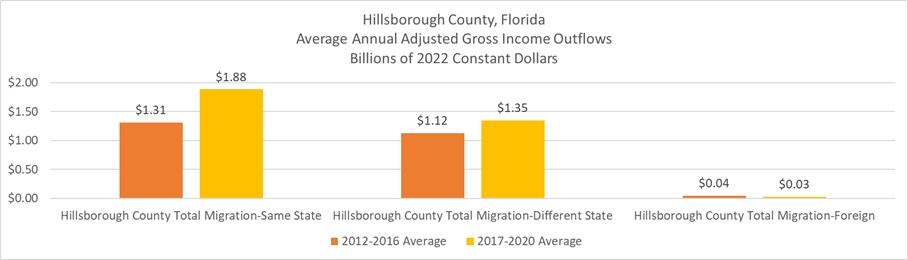
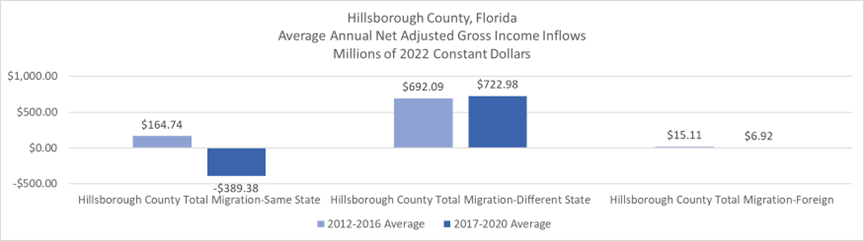
Chart 4 compares AGI outflows from two periods 2012-2016 and 2017-2020. AGI outflows from former Hillsborough County residents moving to other counties on Florida or other states are 20-44% higher than they were in 2012-2016. Alternatively, 2017-2020 average annual AGI outflows from former Hillsborough County residents moving abroad decreased 34%. On average, former Hillsborough residents move $3.3 billion AGI per year.
Chart 4. Average Annual AGI Outflows to Hillsborough County, Florida, by Destination
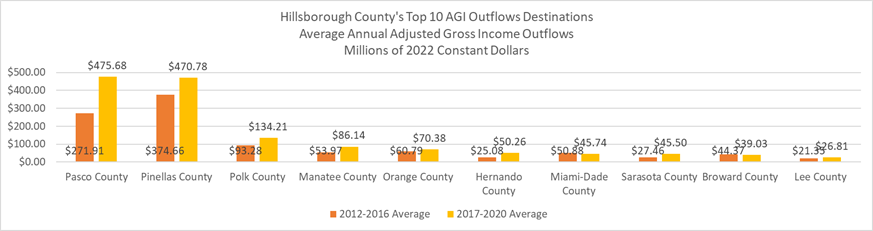
As seen in Chart 5, most new Households (and new AGI) left for Manatee, Pasco, Pinellas, and Polk Counties. In fact, six of the top ten destinations for former Hillsborough County households are in the Tampa Bay Region. They range from 467 (Sarasota County) to 6,788 (Pasco County). Similarly, Chart 6 reveals that 6 of the top 10 AGI outflows moved to other counties in the Tampa Bay Region. These outflows range from $27 million (Lee County) to $476 million (Pasco County).
Chart 5. Former Hillsborough County Households’ Top 10 Destinations in Florida
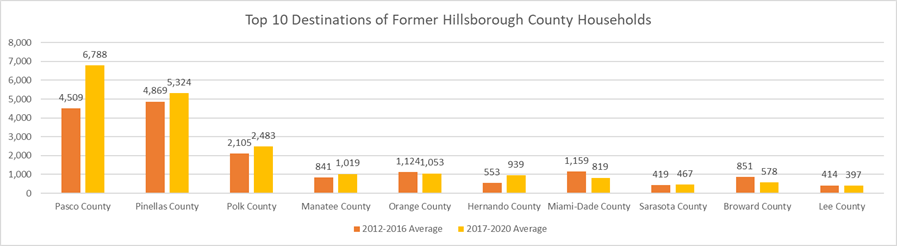
Chart 6. Hillsborough County’s Top 10 AGI Outflows Destinations
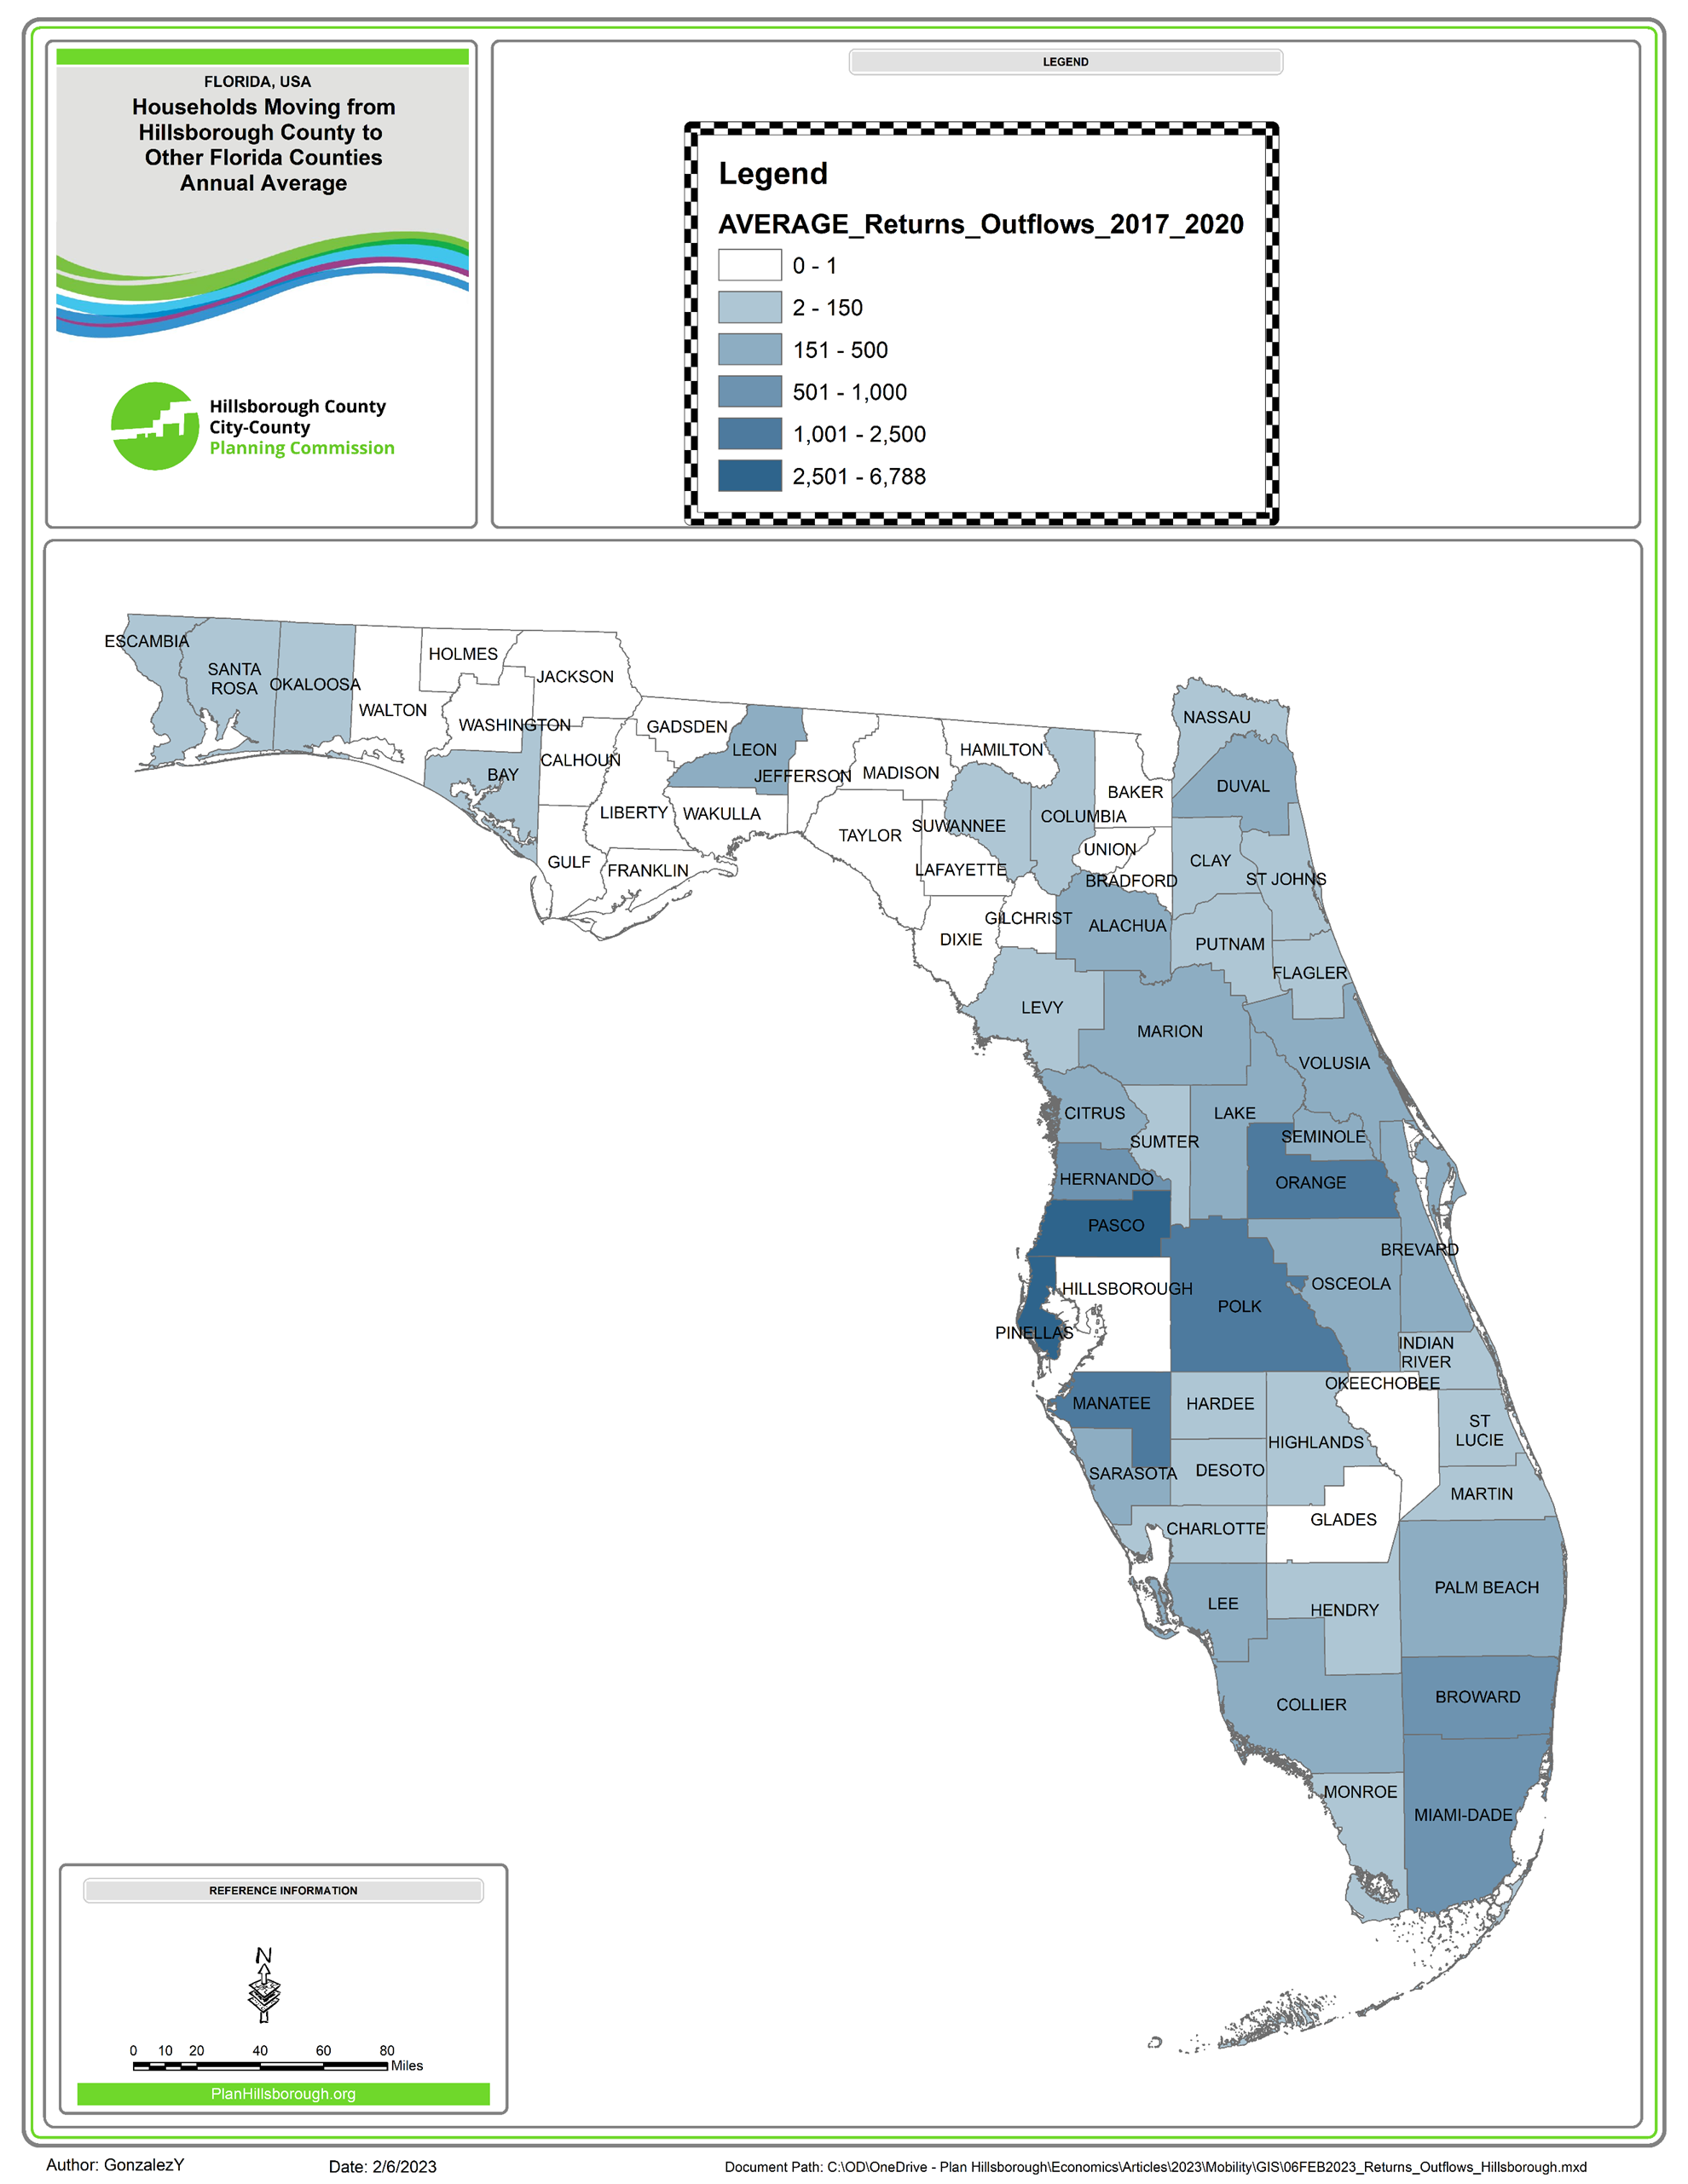
Map 1 shows destination counties for former Hillsborough County residents. Annually, over 1,000 former Hillsborough County residents move to Manatee, Pasco, Pinellas, and Polk. Map 2 shows how much AGI former residents are moving away from Hillsborough County. Annually, former residents move over $75 million to Manatee, Pasco, Pinellas, and Polk.
Map 1. Destination Counties for Former Hillsborough County Residents
Map 2. Destination Counties for AGI of Former Hillsborough County Residents
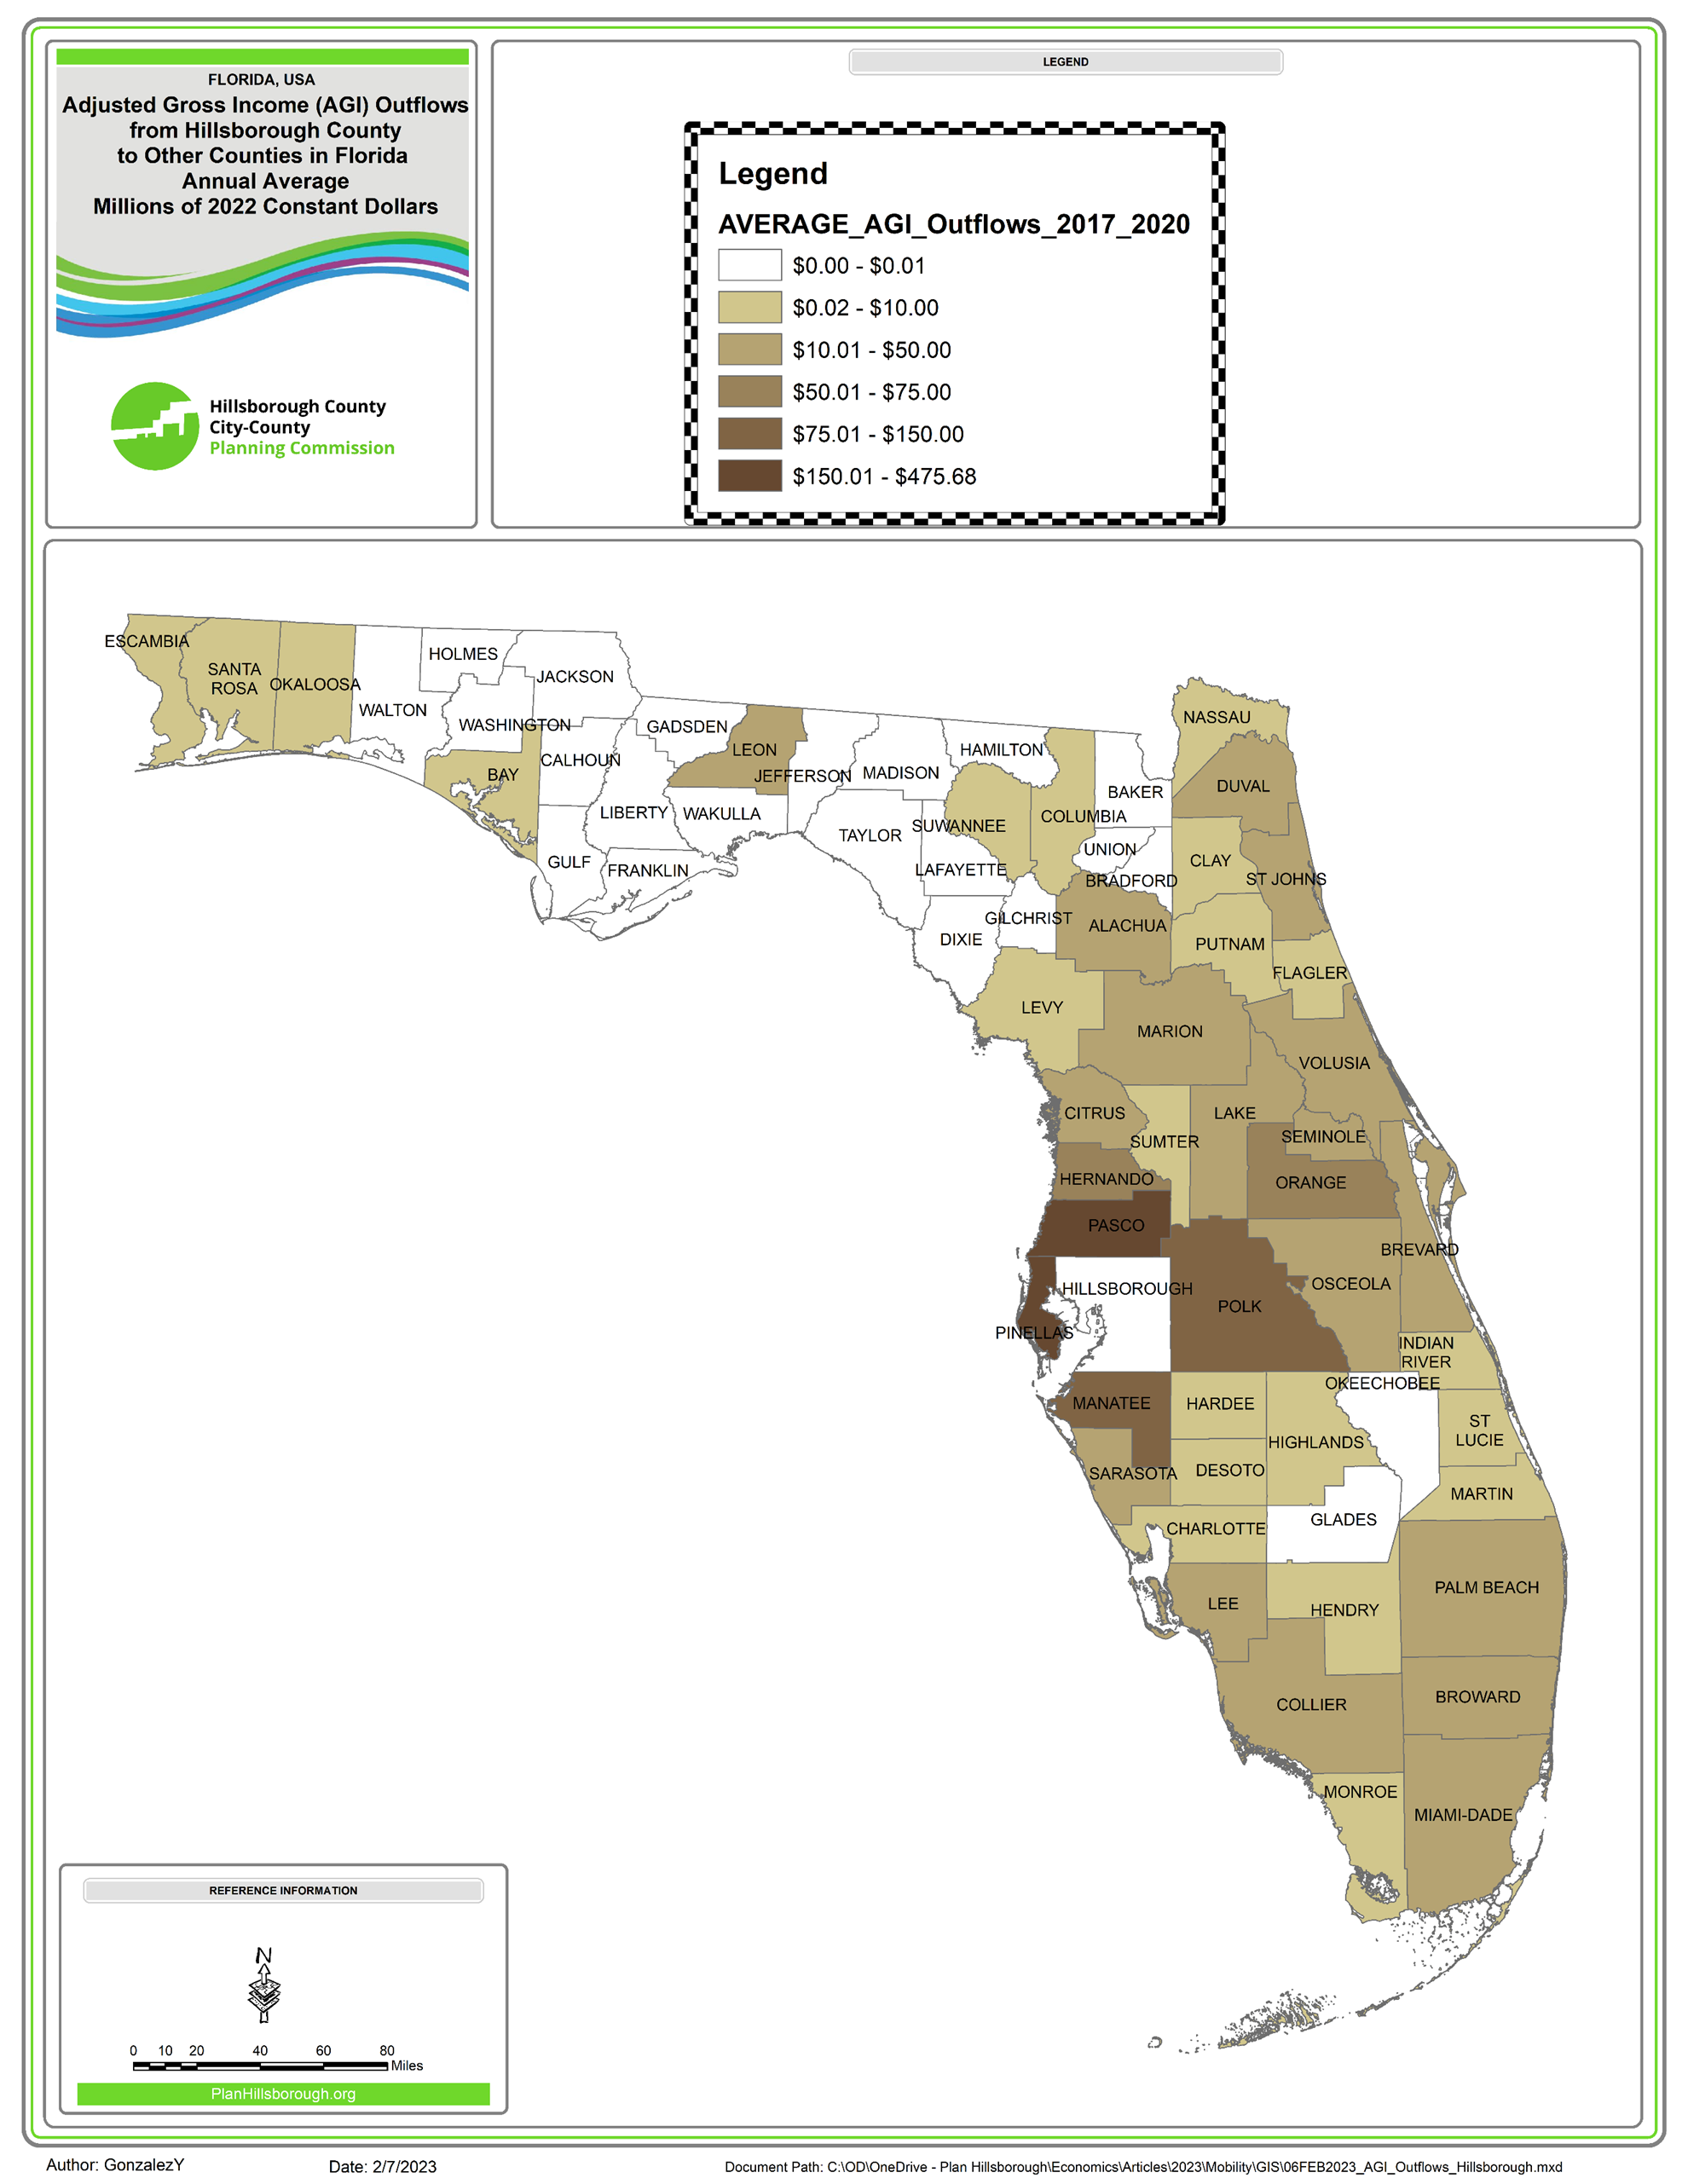
Chart 7 shows the 10 Florida counties losing the most households. Except for Broward and Miami-Dade, the other eight counties (e.g., Hillsborough, Orange, Pinellas) are losing more households than in the period 2012-2016.
Chart 7. 10 Florida Counties losing the most households
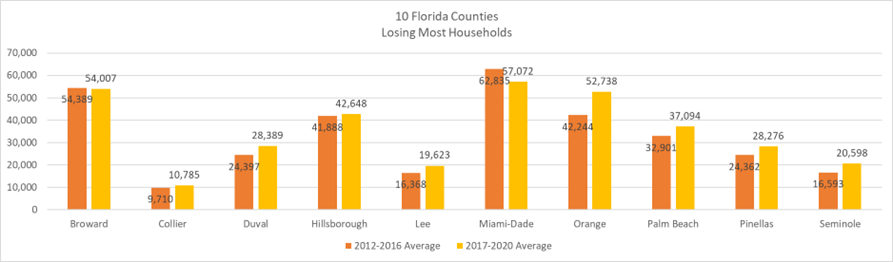
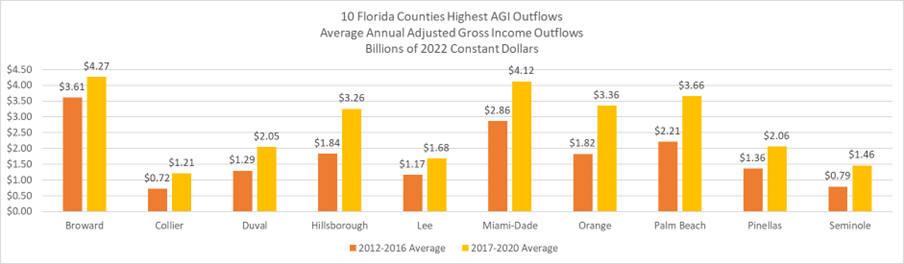
Chart 8 shows Hillsborough ranks 5th amongst Florida counties with highest AGI Outflows. Pinellas County is the other Tampa Bay Region County in these Top 10. These AGI outflows range from $1.21 billion (Collier County) to $4.27 billion (Broward County).
Chart 8. 10 Florida Counties with Highest AGI Outflows
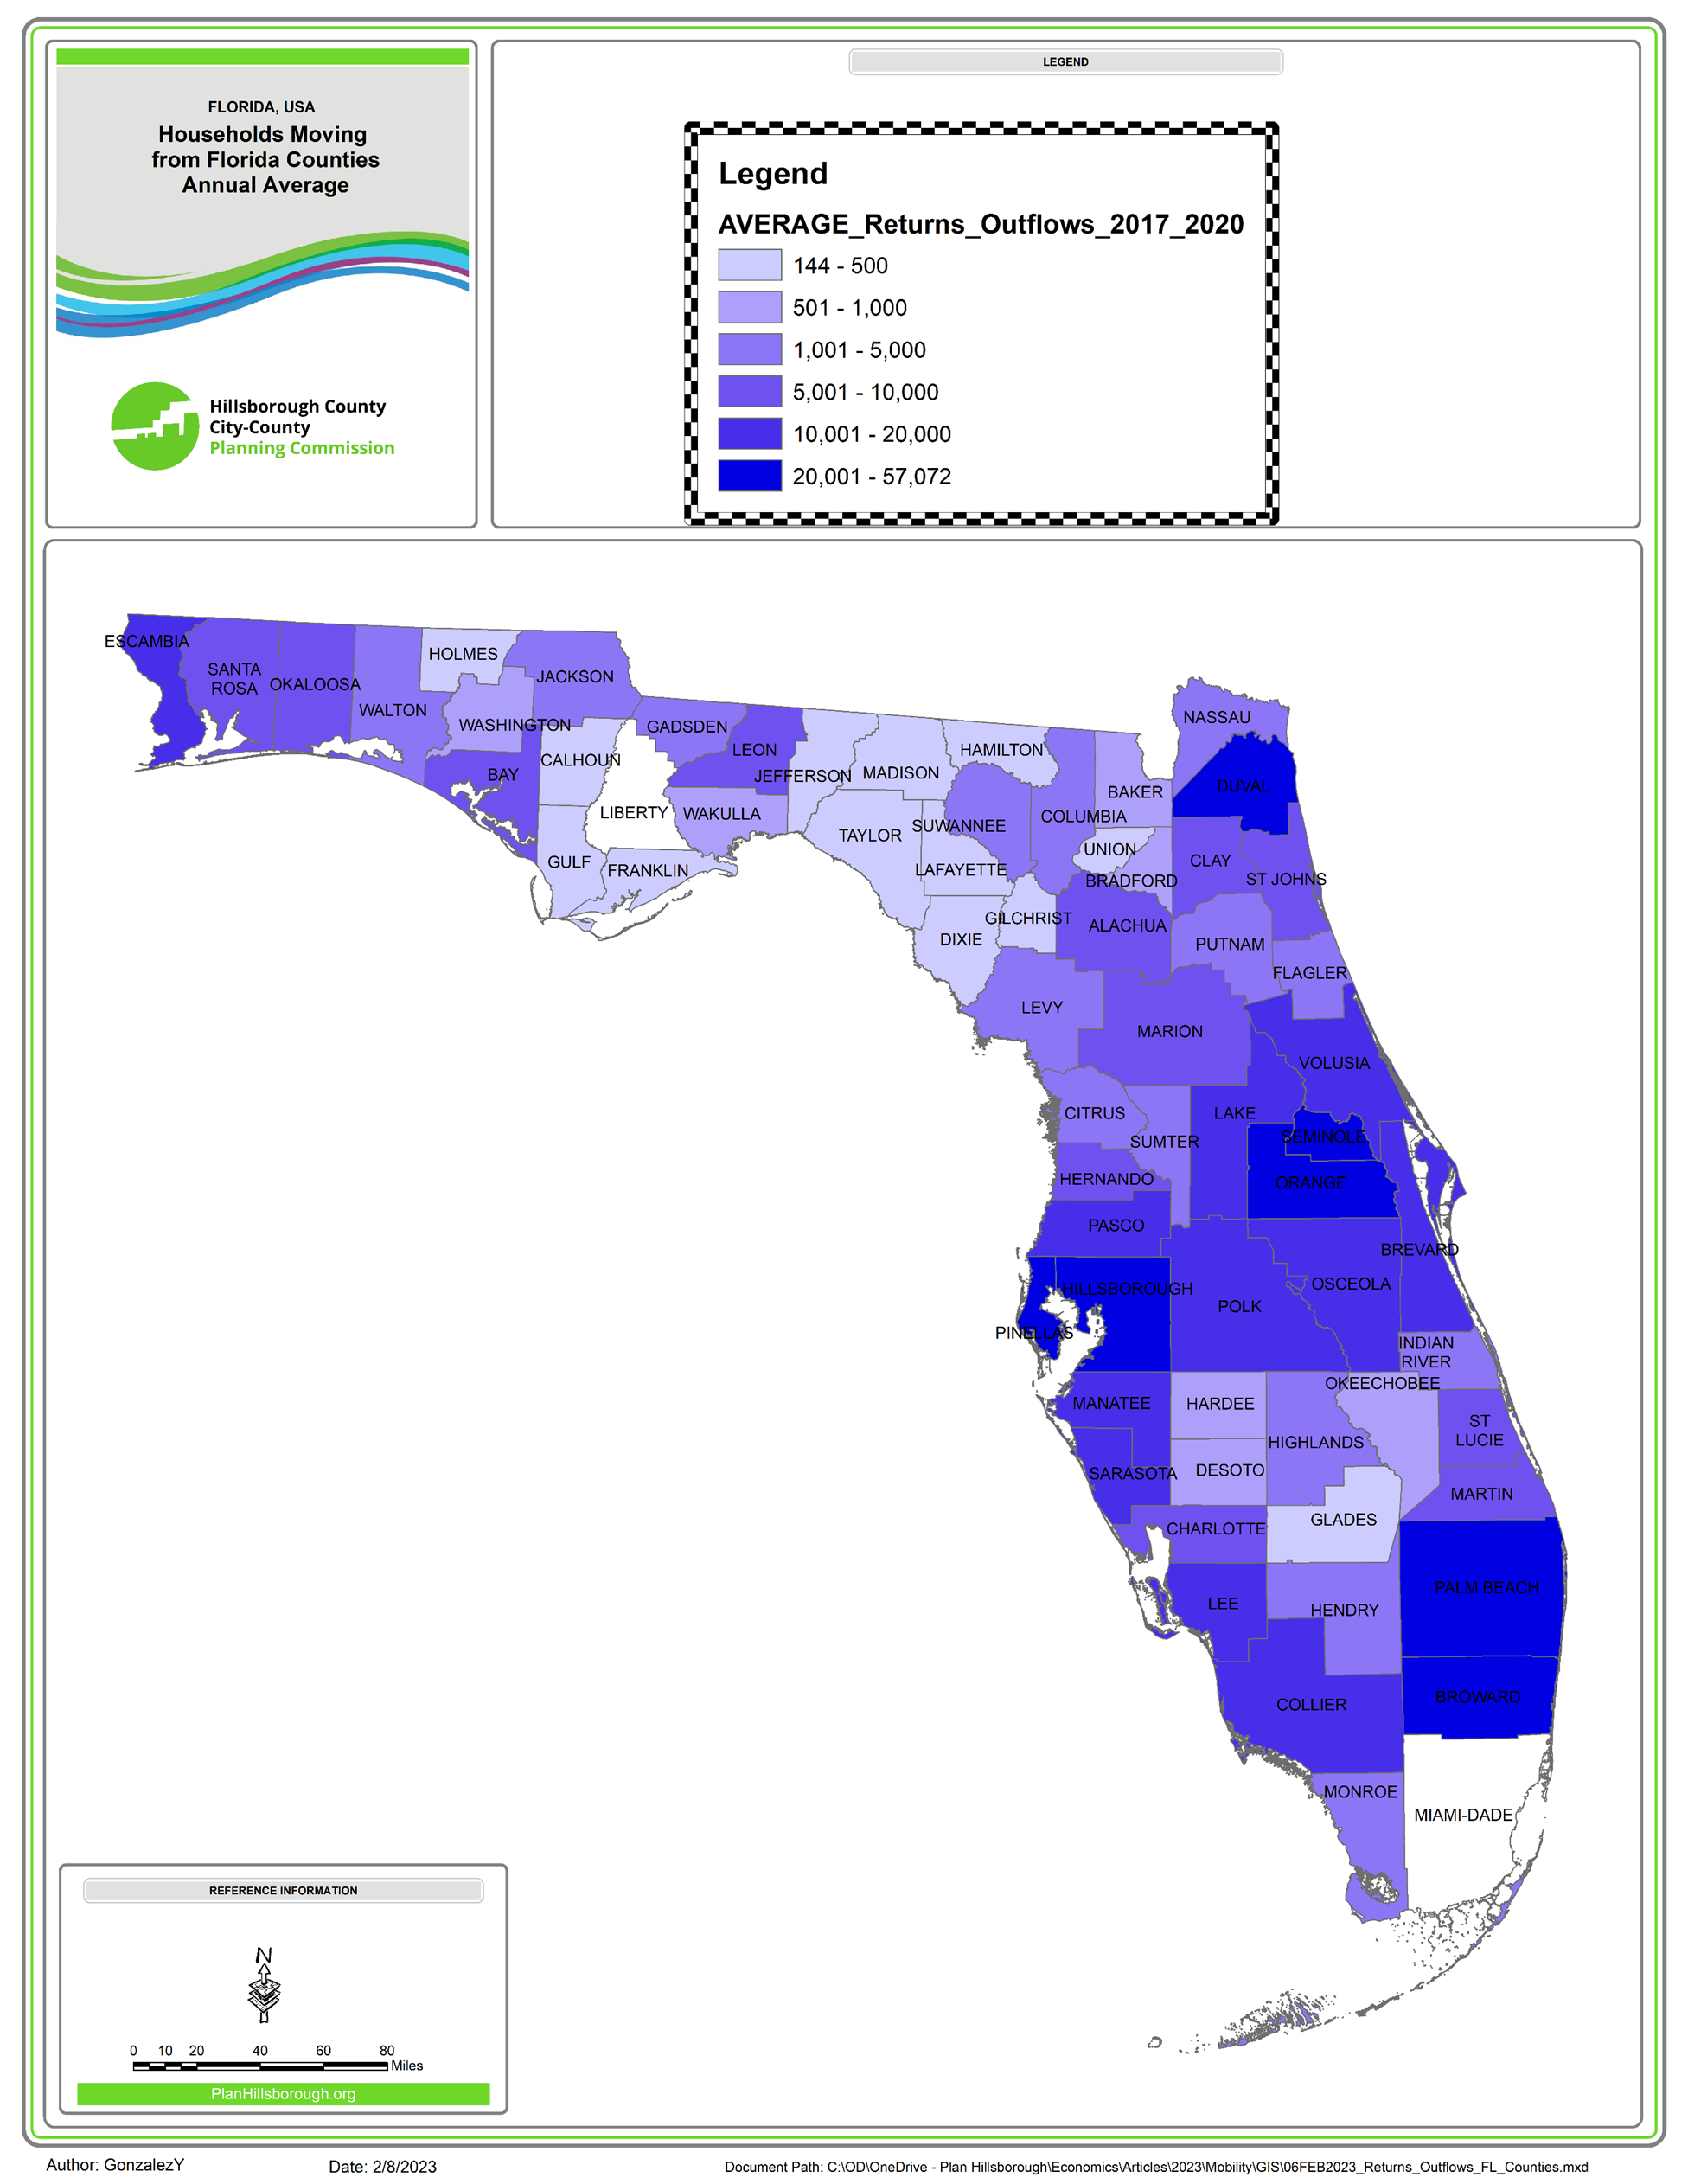
Map 3 shows Florida counties by number of households leaving for other areas inside and outside Florida. As we can see, Hillsborough and Pinellas County are amongst the top counties losing households. Map 4 shows how much AGI is being moved out these counties annually. Hillsborough and Pinellas are losing over $1.5 billion AGI every year.
Map 3. Households Leaving Florida Counties to Other Areas Inside and Outside Florida
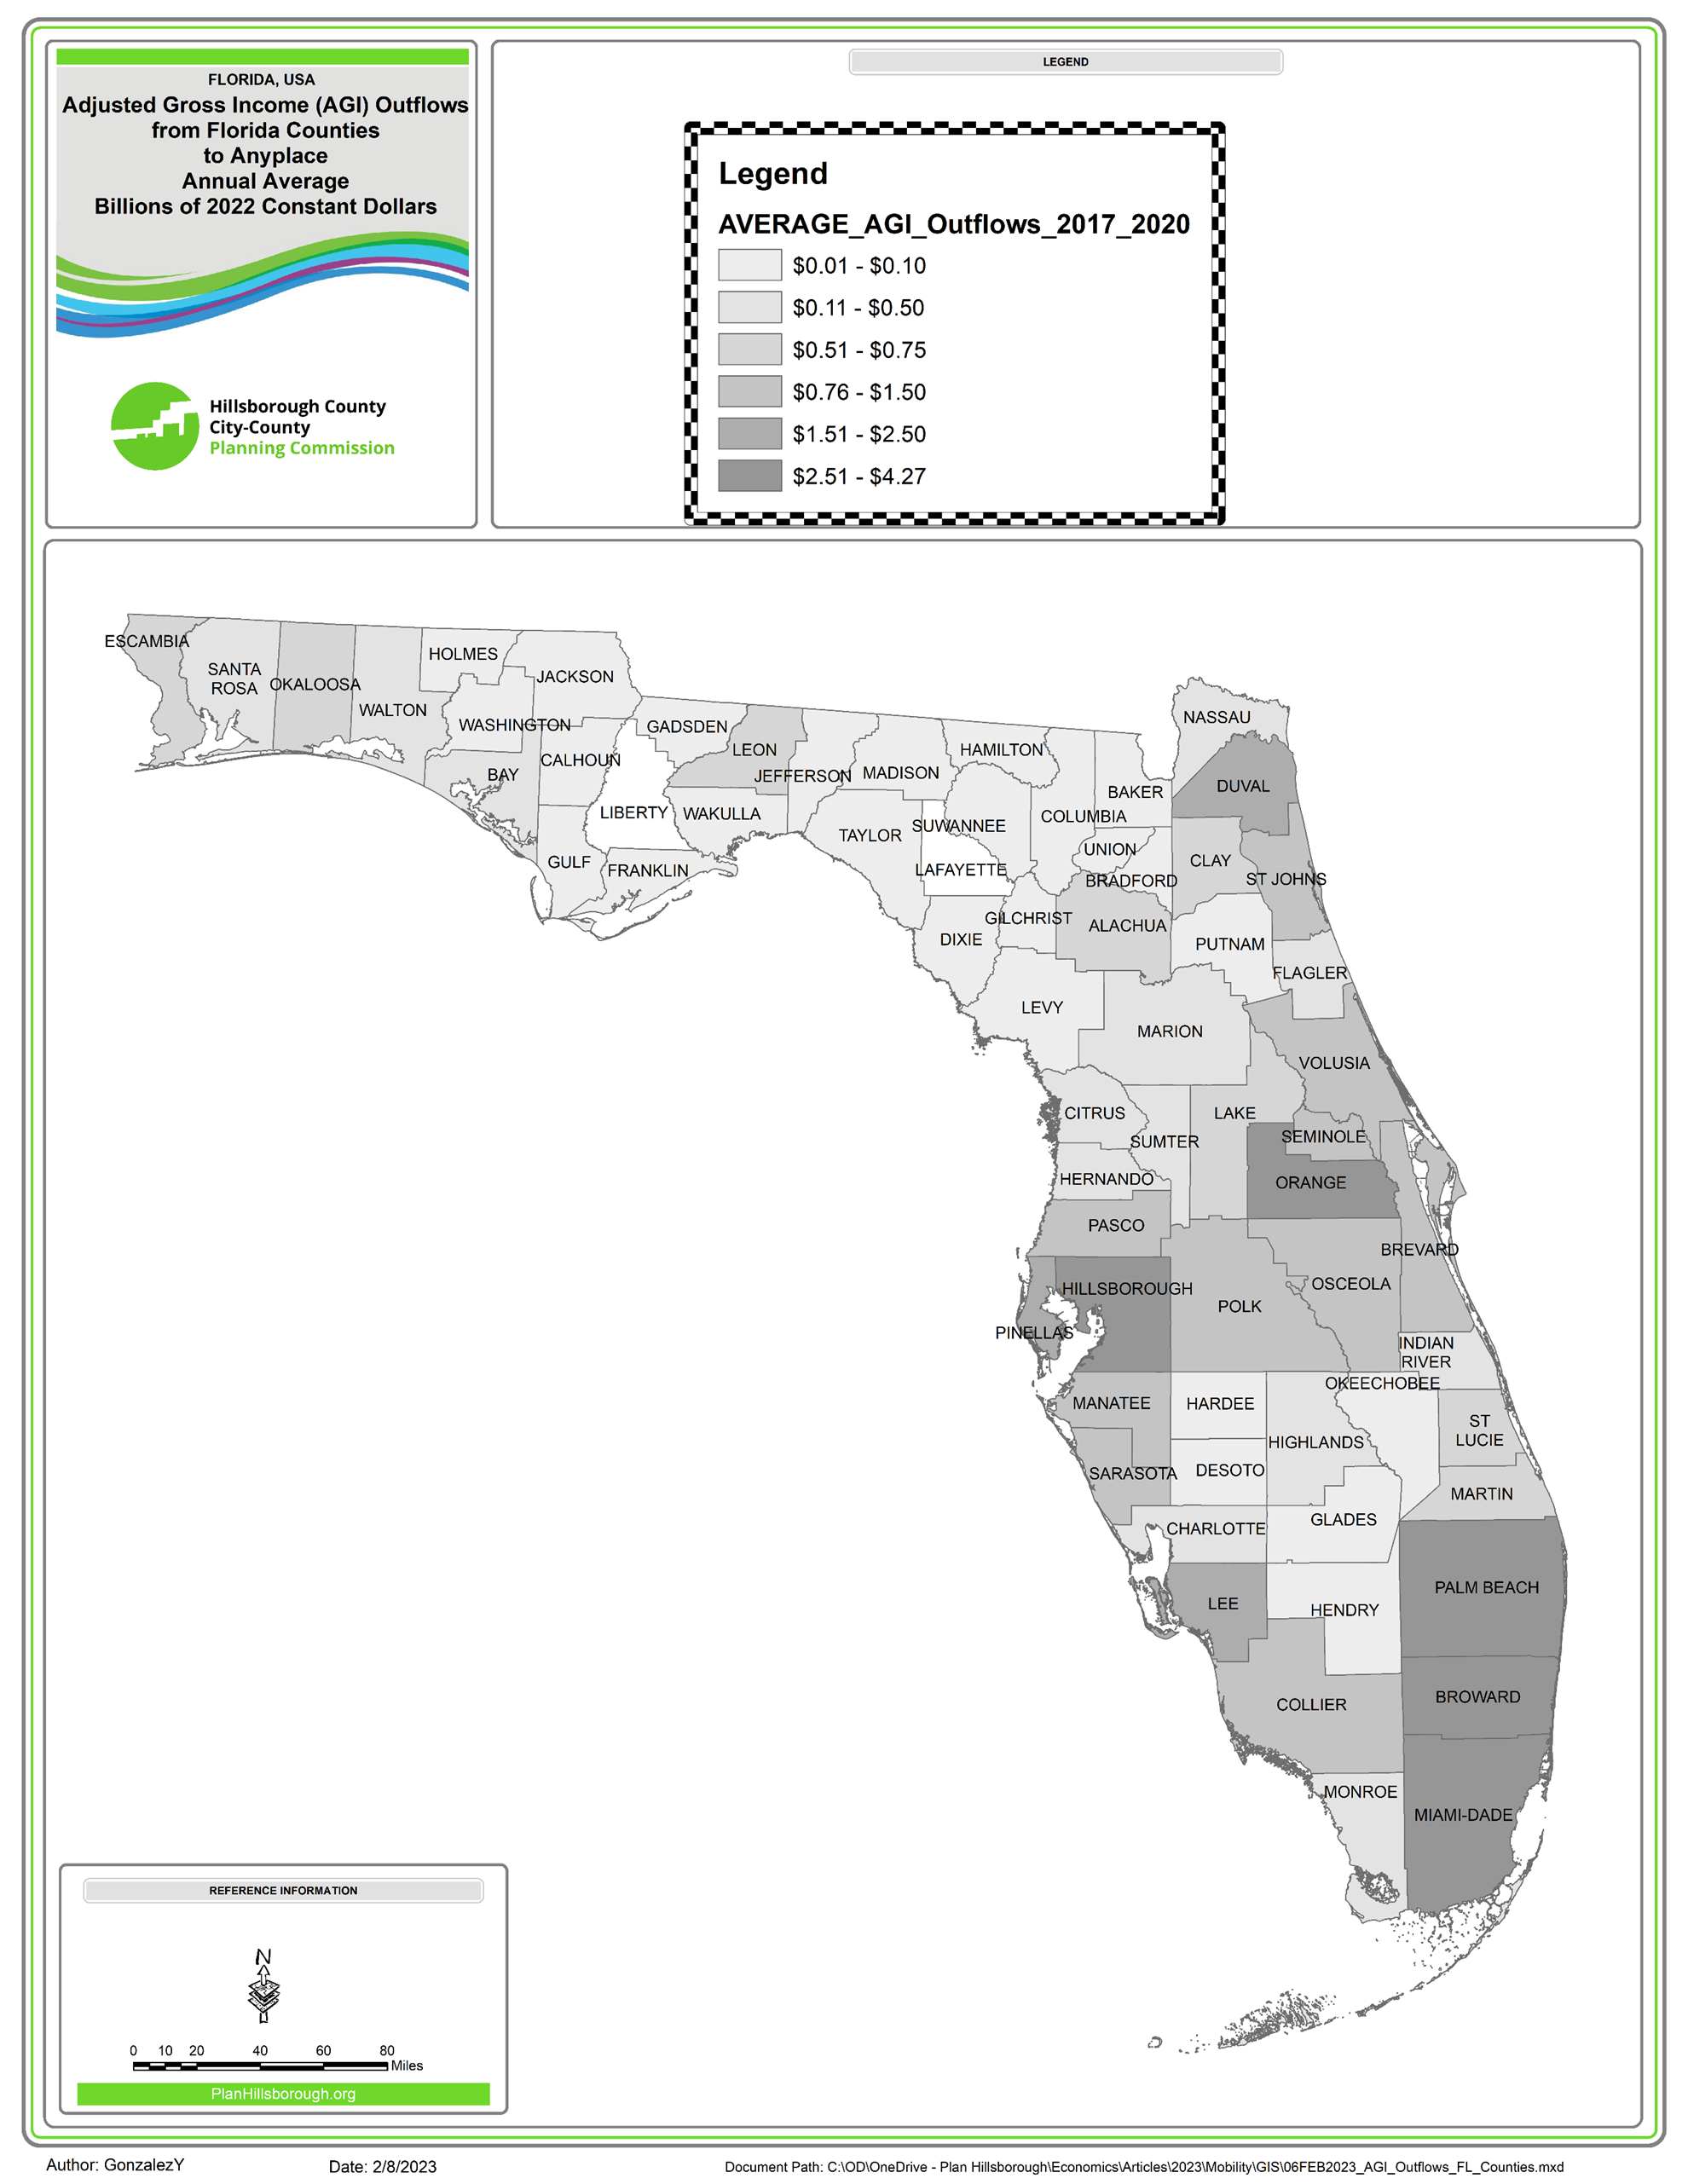
Map 4. AGI Outflows from Florida Counties to Other Areas Inside and Outside Florida
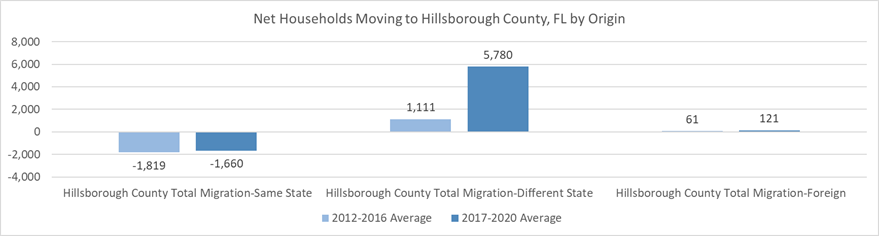
Lastly, we look at net inflows of households and AGI. As seen on Chart 9, Hillsborough County is attracting 4,242 more households than it loses. Only in 2012 and 2013, it appears that Hillsborough County lost more households than it attracted. Nonetheless, these number appear to be outliers. Chart 10 reveals that Hillsborough County loses 1,660 to other Florida counties and gains 5,780 households from outside Florida.
Chart 9. Net Households Moving to Hillsborough County, FL
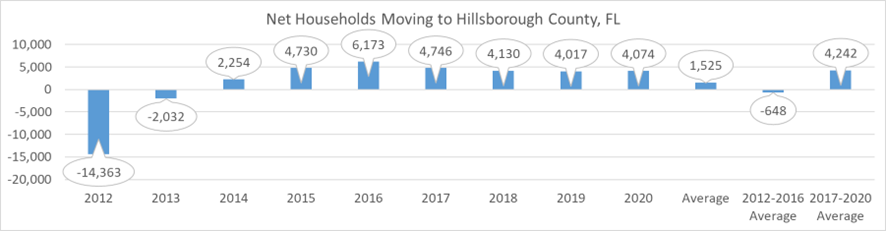
Chart 10. Average Net Households Moving to Hillsborough County, FL, by Origin
In terms of net AGI Inflows, Hillsborough County is netting $340.52 million per year. This appears to be lower than the 2012-2016 average. Again, 2012 is very large and appears to be an outlier. Chart 12 reveals that net gains of AGI Inflows originate from outside Florida.
Chart 11. Net AGI Inflows for Hillsborough County, FL
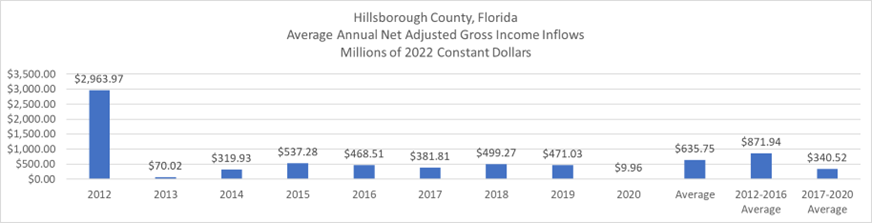
Chart 12. Average Net AGI Inflows for Hillsborough County, FL, by Origin
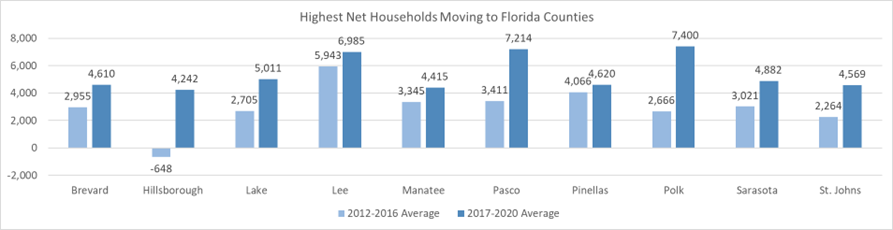
Most Florida counties (88%) have positive net new households every year. In other words, they are attracting more new households than they are losing. Chart 10 shows that 6 of the 10 counties with the highest net new households are in the Tampa Bay Region. Pasco, Polk, and Lee attract the most net new households.
Chart 13. 10 Florida Counties with Highest Net New Households
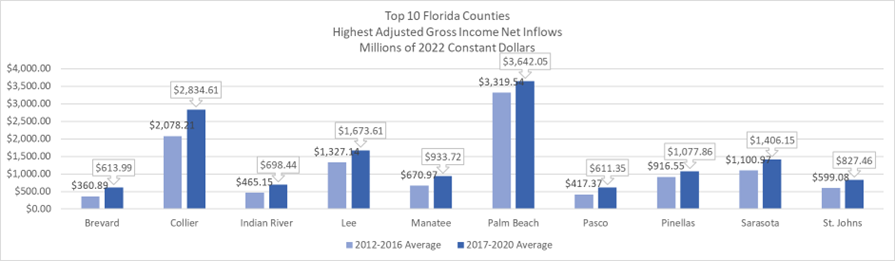
Sixty-one of 67 counties in Florida (91%) show positive average Net AGI Inflows in the period 2017-2020. As seen in Chart 14, four of the Top 10 counties with highest Net AGI Inflows are in the Tampa Bay Region. Top 10 2017-2020 average annual Net AGI Inflows f range from $611.35 million (Pasco County) to $3,642.05 million (Palm Beach County). All these counties saw their average Net AGI Inflows increase since 2017.
Chart 14. Top 10 Net AGI Inflows for Florida Counties
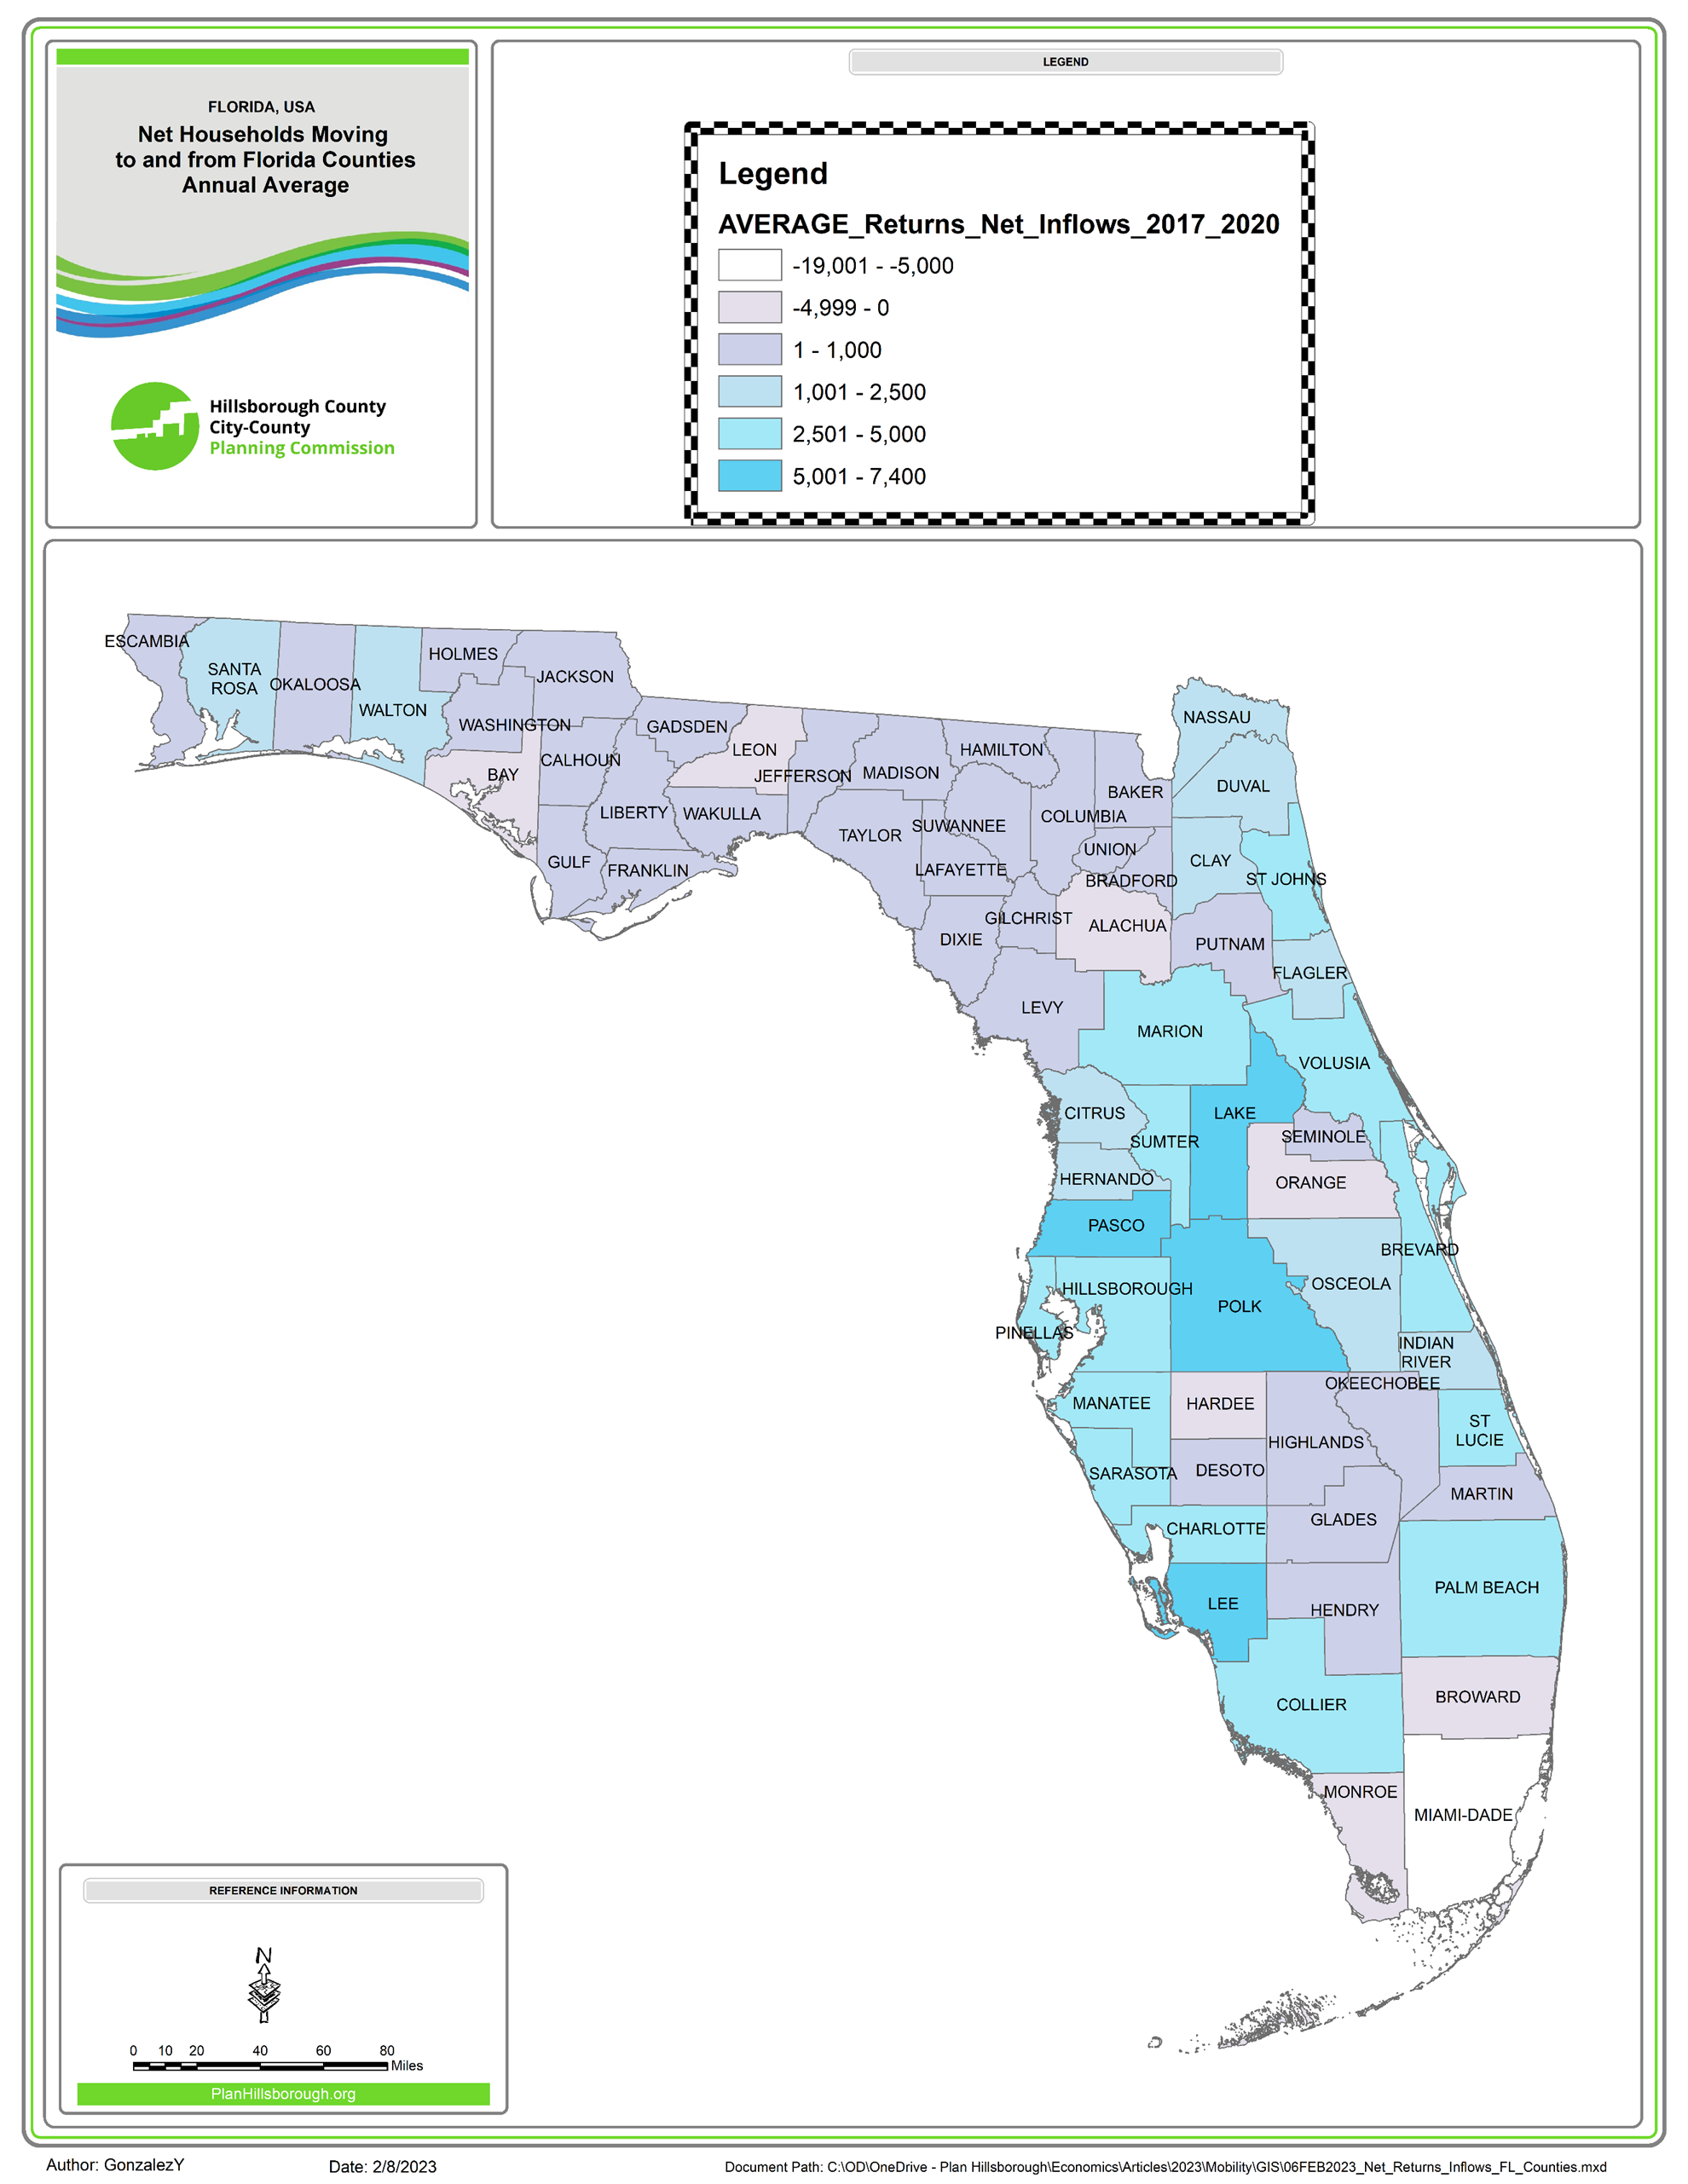
Map 5 shows Florida counties and their net new households. Lake, Lee, Pasco, and Polk have the highest net new households in Florida. Map 6 shows AGI netted by each county. Pinellas and Sarasota Counties net over $1 billion AGI every year.
Map 5. Net New Households Moving to Florida Counties
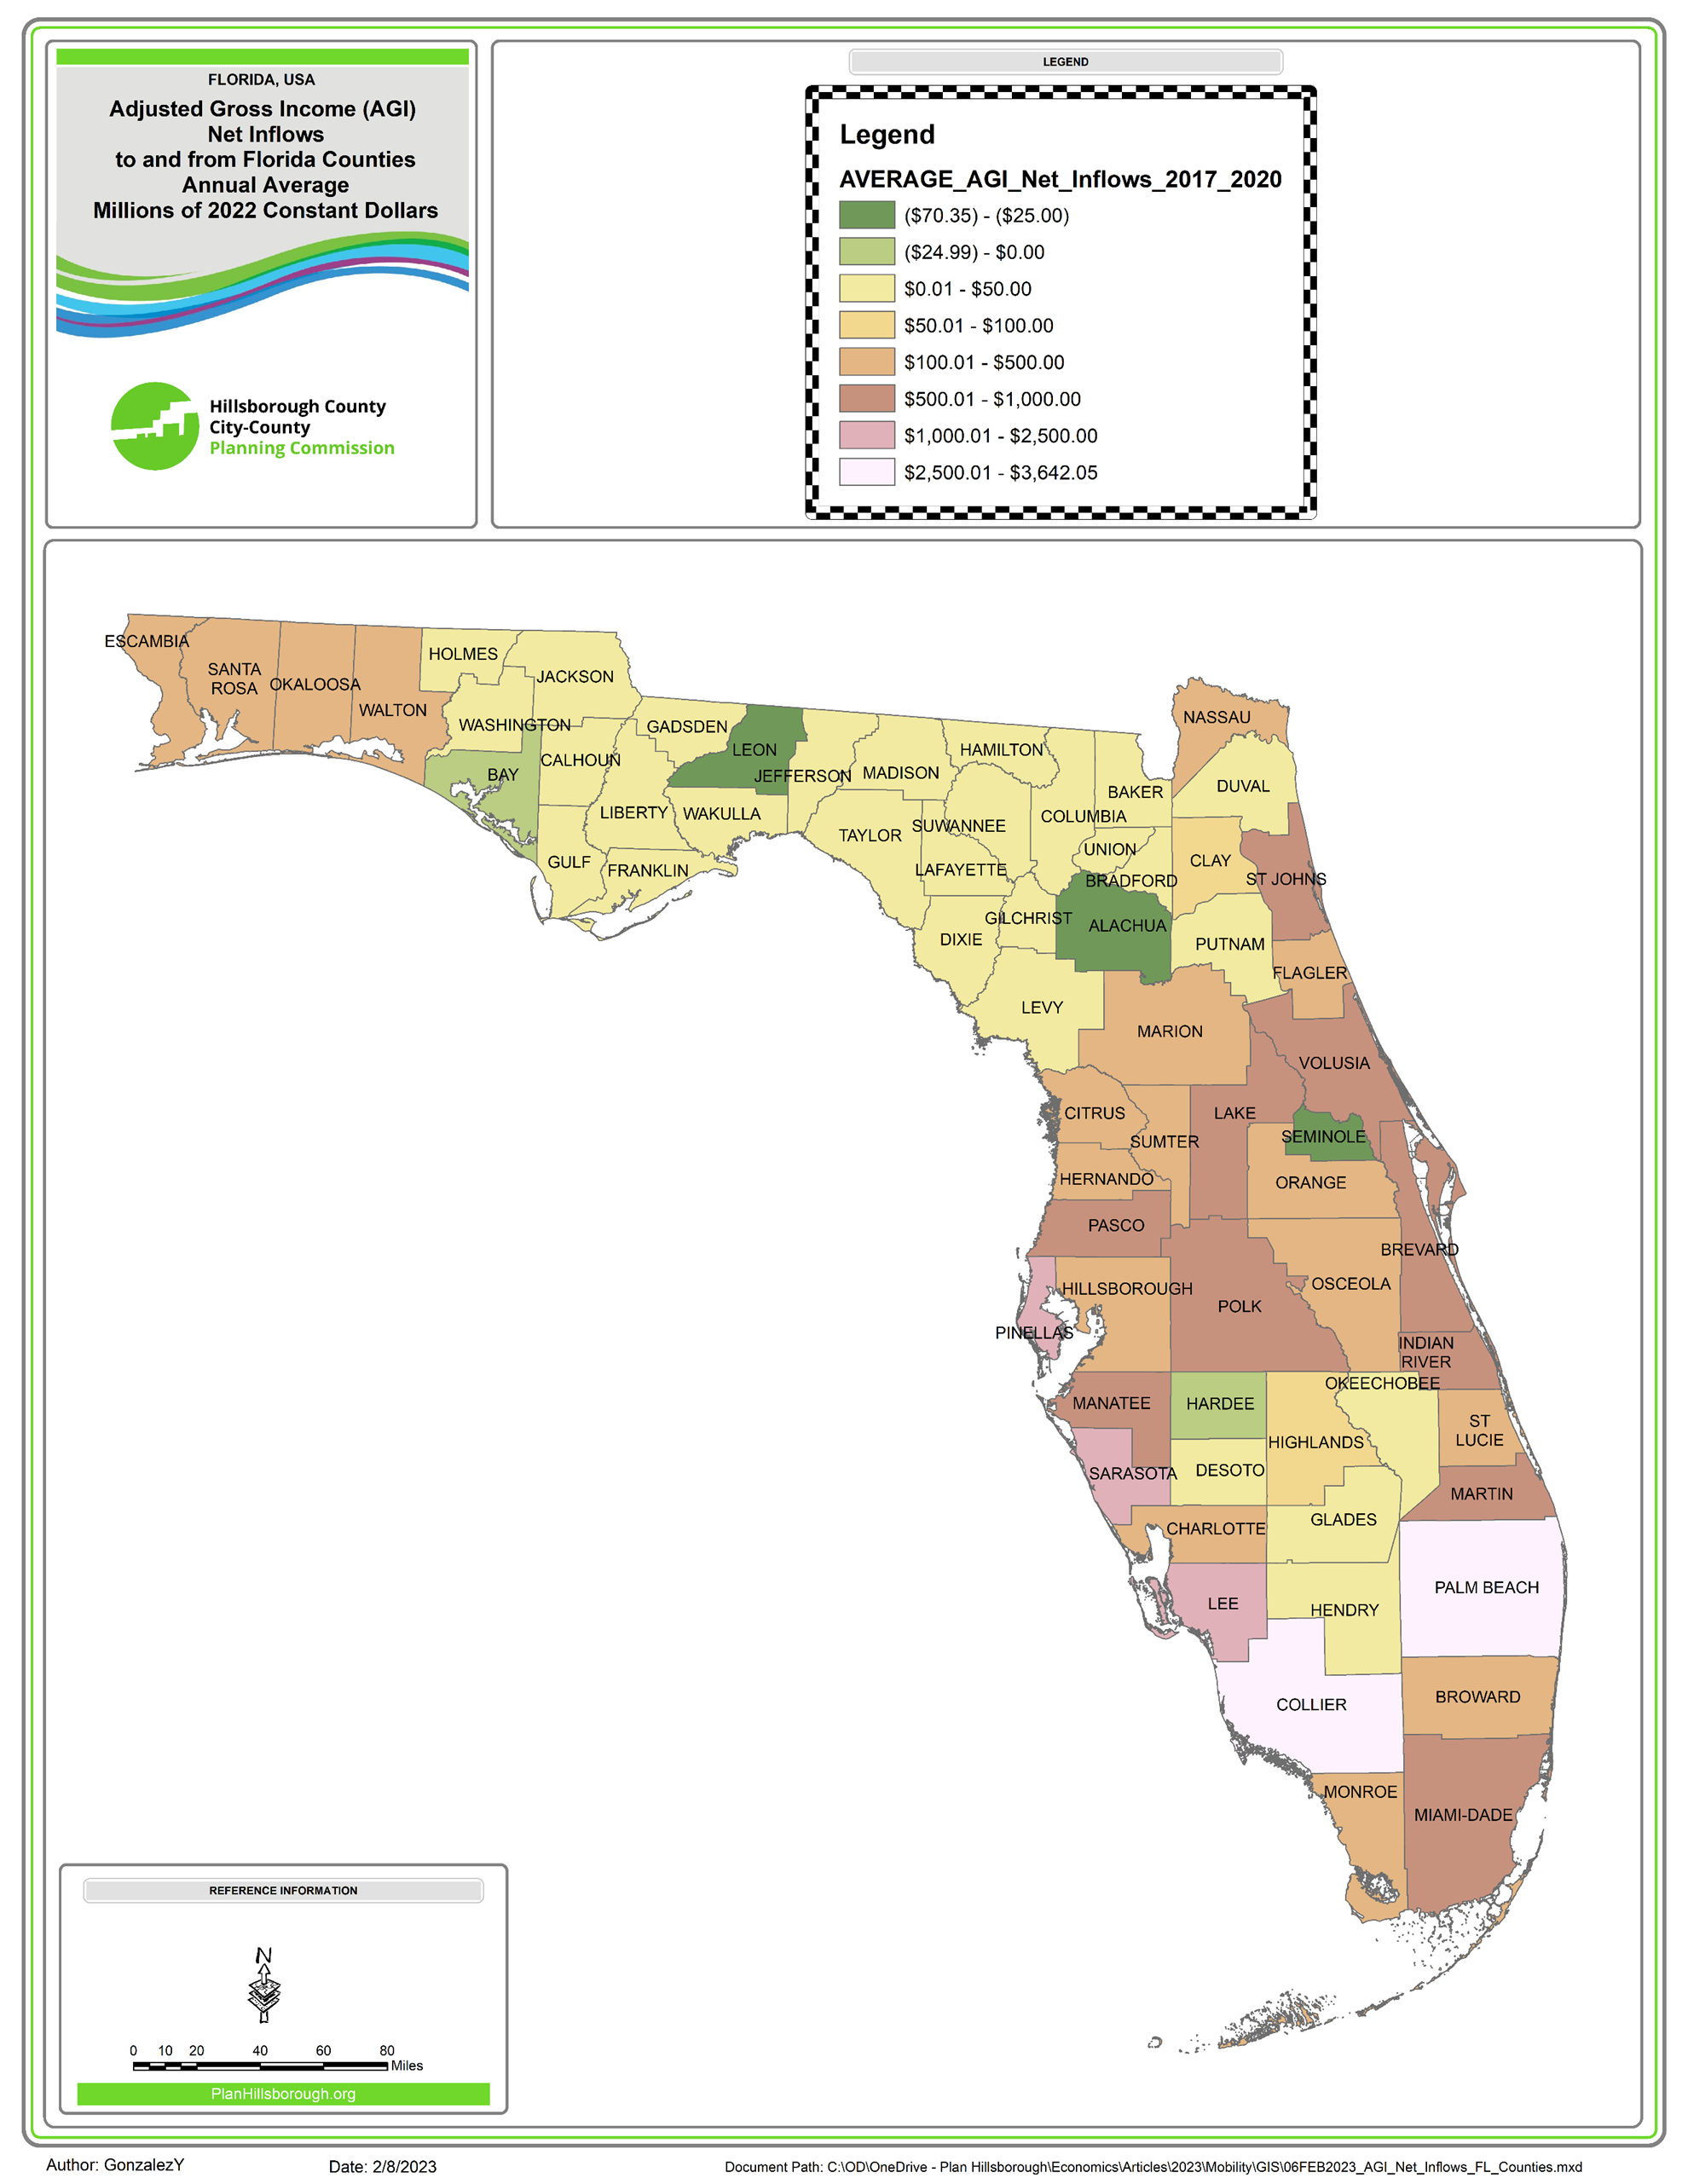
Map 6. Net AGI Inflows to Florida Counties
As a bookend to the previous article where we reviewed new households and AGI Inflows, here we have looked at households and AGI leaving Hillsborough County. As we have discussed, Hillsborough County loses 42,648 households and $3.3 billion AGI per year. Nonetheless, Hillsborough nets a respectable number of new households (4,242 households) and AGI ($352.52 million) every year. In fact, the Tampa Bay Region is one of the foremost destinations for new households and AGI originating outside Florida.
[i] Internal Revenue Service. Statistics of Income. 2012-2020 Migration Data. https://www.irs.gov/statistics/soi-tax-stats-migration-data
[ii] For the purposes of this article, an “IRS return” to represent one household. Most married couples filed jointly. See here: https://www.cbsnews.com/news/when-married-couples-should-file-separate-tax-returns/
[iii] Per convention, all monetary figures are shown in 2022 constant dollars. Calculations were done using CPI data for all urban consumers in Tampa-St. Petersburg-Clearwater, FL MSA (not seasonally adjusted). Link: https://www.bls.gov/cpi/data.htm