


Published
August 14, 2023
Contact
Yassert A. Gonzalez |
Manager – Economics, Demographics & Research |
813.582.7356 | [email protected]
Last updated
August 25, 2023
According to BEBR’s latest forecast by age cohort[i], Florida is expecting 2.5 million new residents aged 65 and over through 2050. Around 500,000 of these new residents are expected to choose Tampa Bay as their new home. In this article, we’re looking at trends in population growth by age groups for Hillsborough and the other seven counties in the Tampa Bay Region.
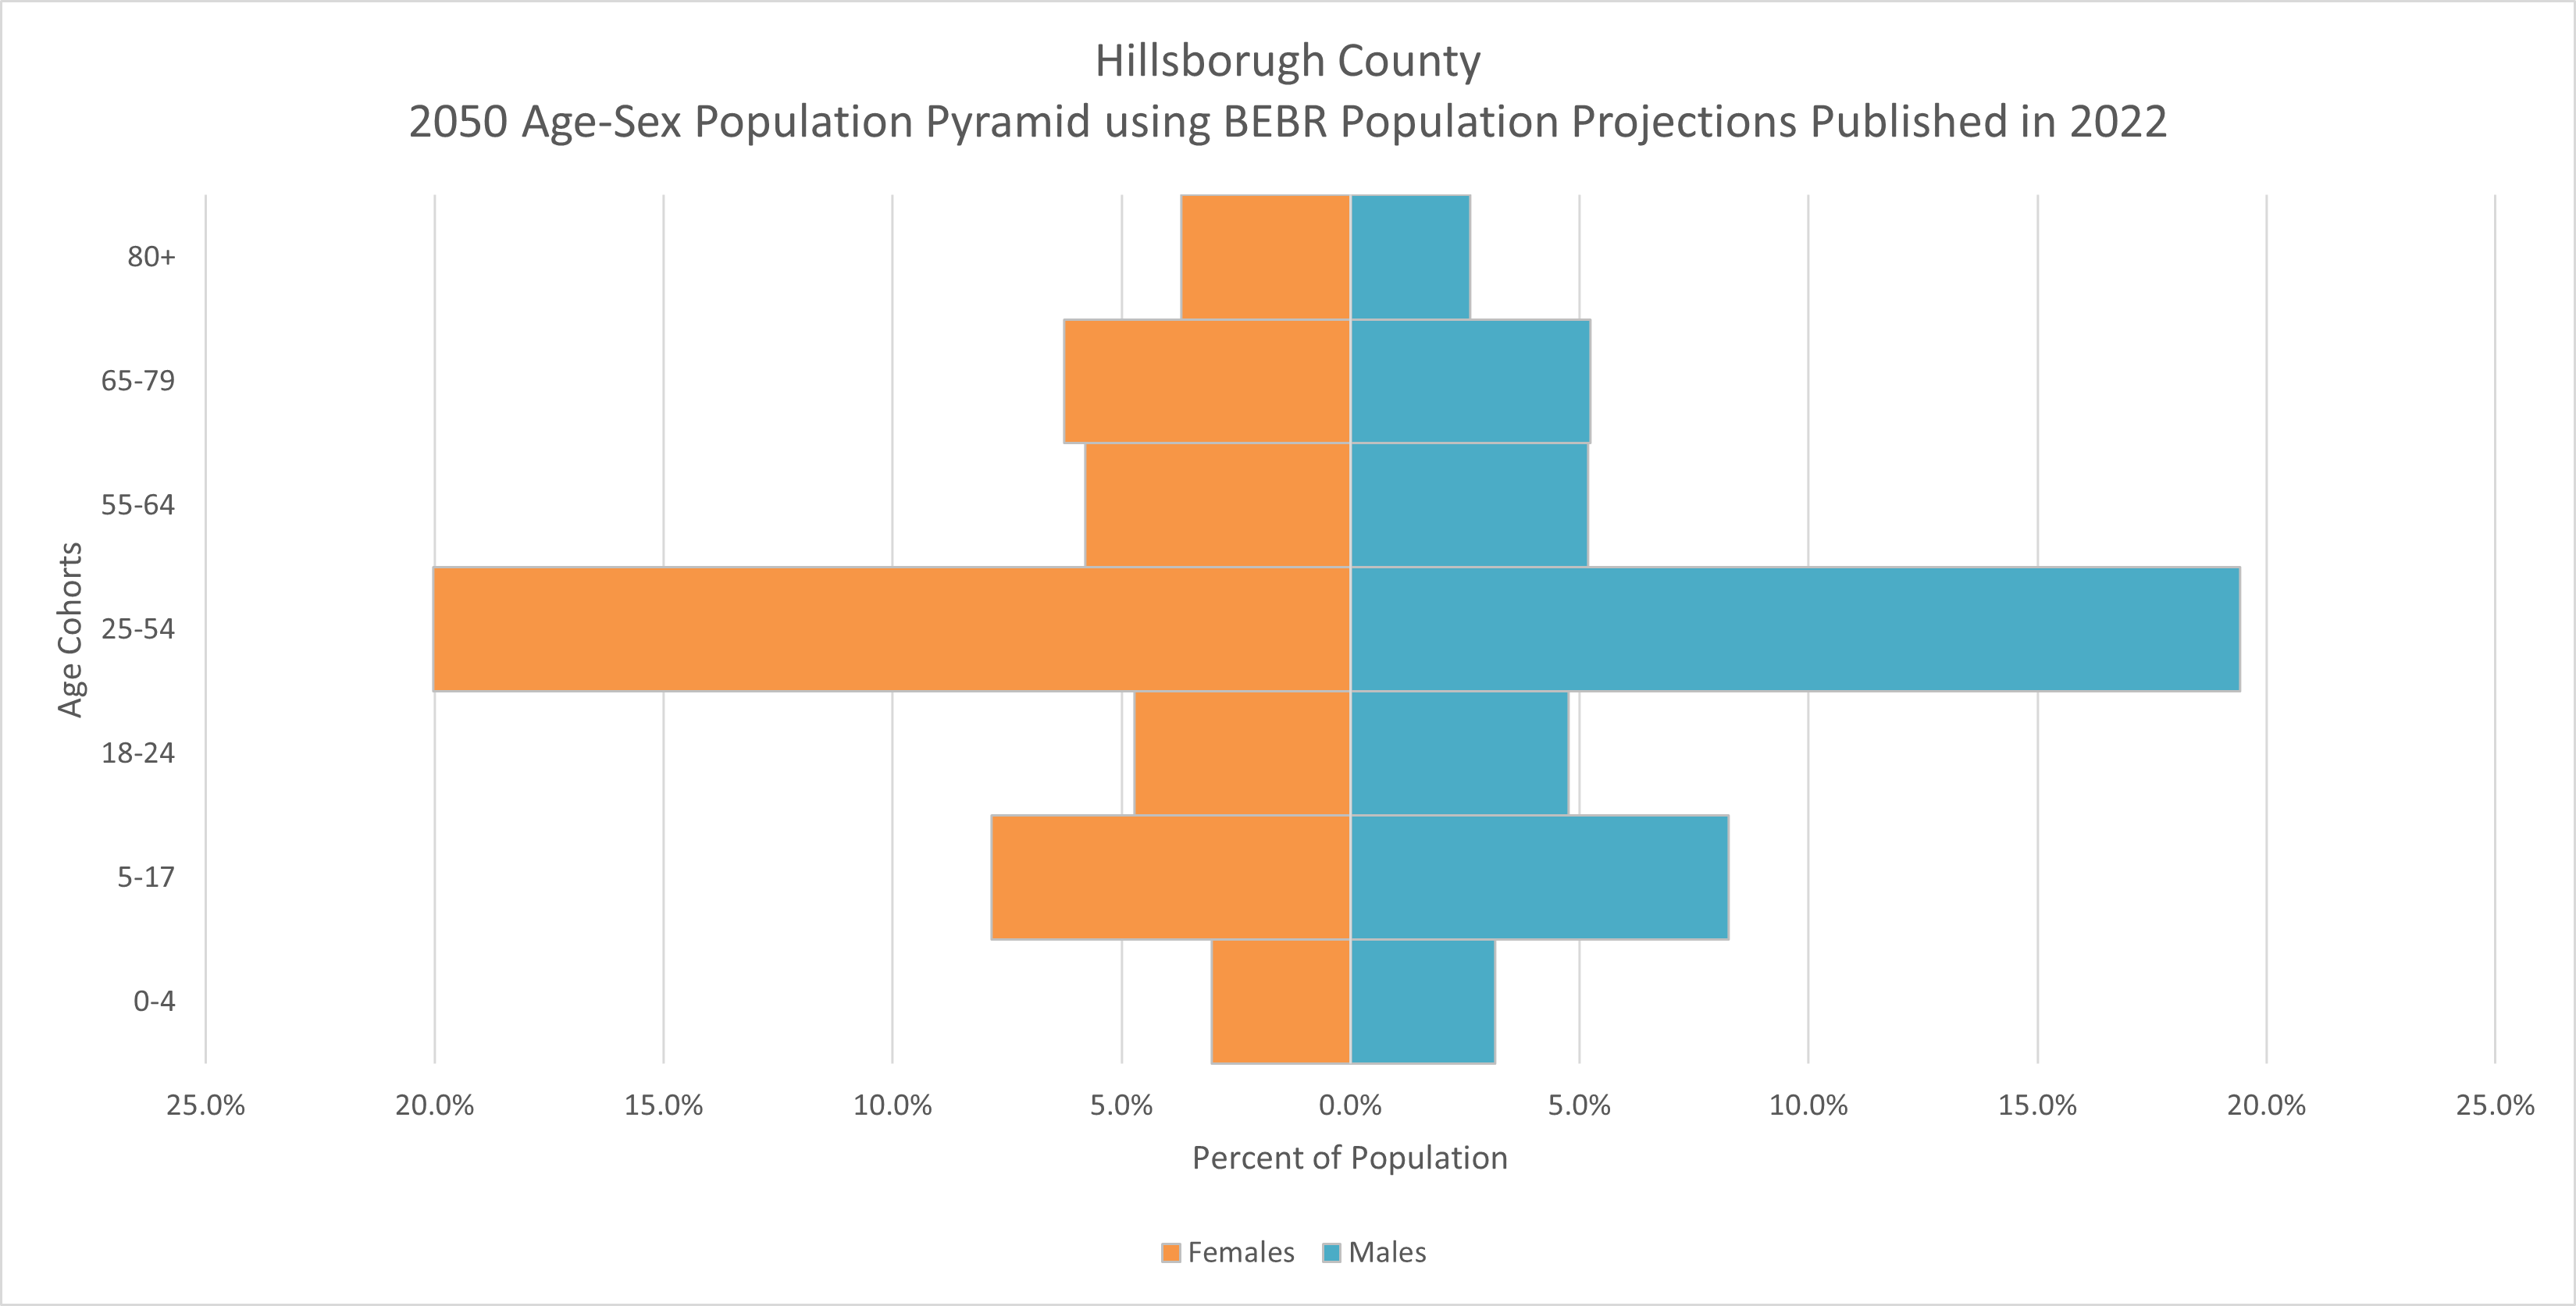
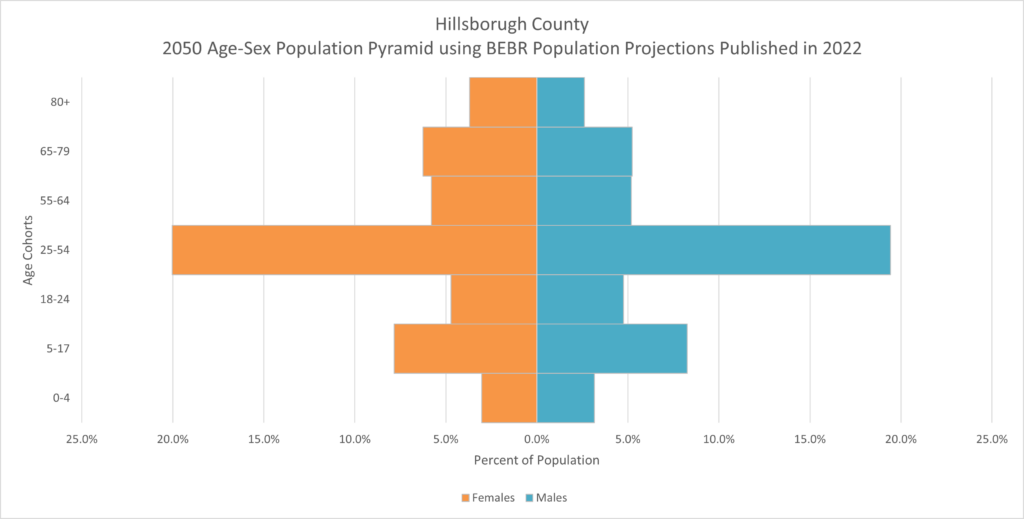
For simplicity, we are going to look at shares and growth trends using three age cohorts: Ages 0-17 (minors), ages 18-64 (working age population), and ages 65 and over (retirees). As seen in Figures 1a to 1f, Hillsborough County’s working age population has been declining. Conversely, the retiree population has been increasing. In 2021, the working age population was 62.2% (down from 64.3% in 2010) and the retiree population was 14.4% (up from 11.8% in 2010). By 2050, the working age population will be 59.9% of the total population (down from 62.2% in 2021) and the retirees will be 17.8% of the total county population (up from 14.4% in 2021).
Figure 1a. Share of 2010 Population Estimate by Age Cohort for Tampa Bay Region Counties
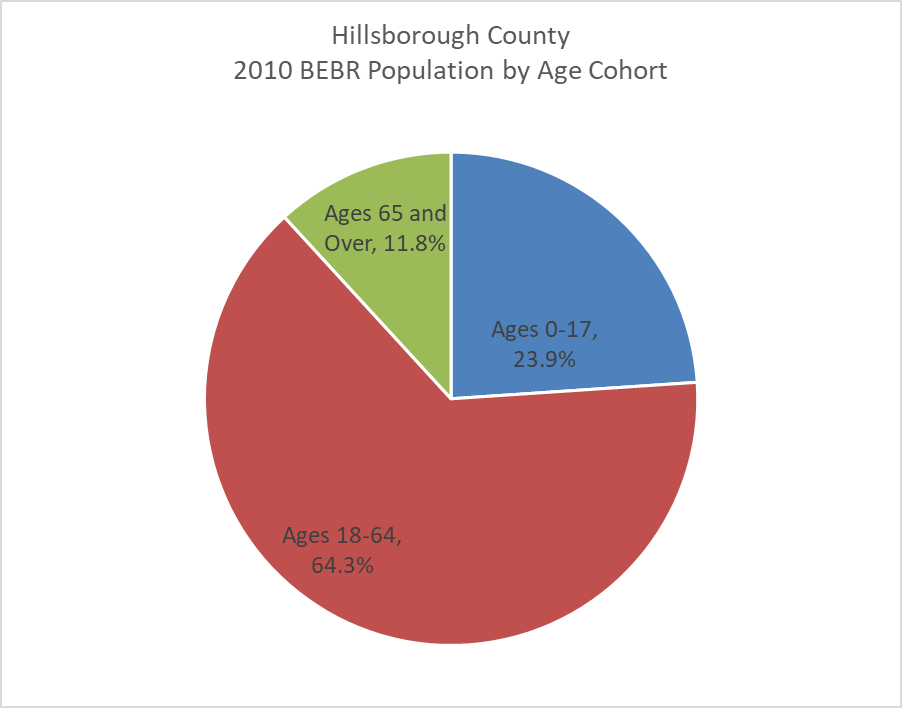
Figure 1b. 2010 Population Pyramid for Tampa Bay Region Counties
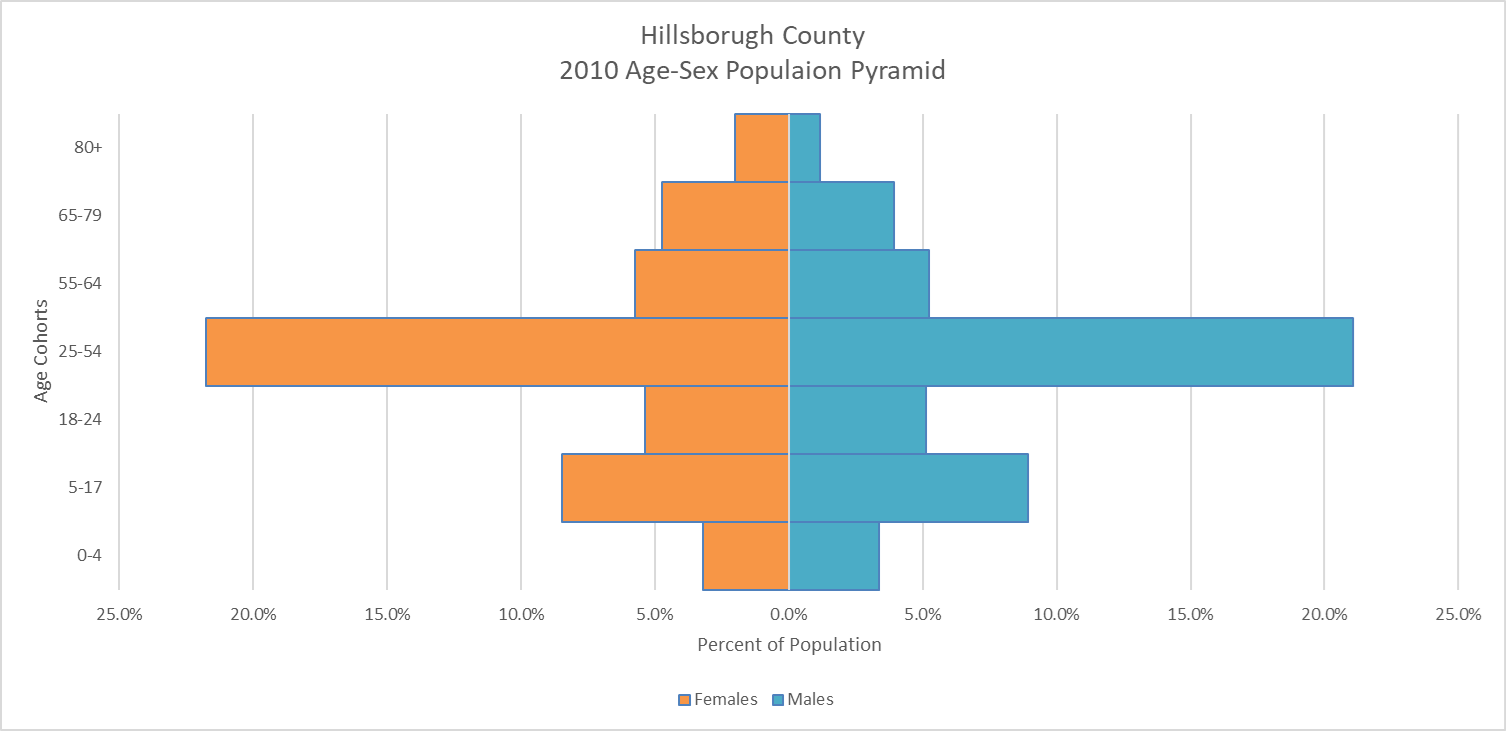
Figure 1c. Share of 2021 Population Estimate by Age Cohort for Tampa Bay Region Counties
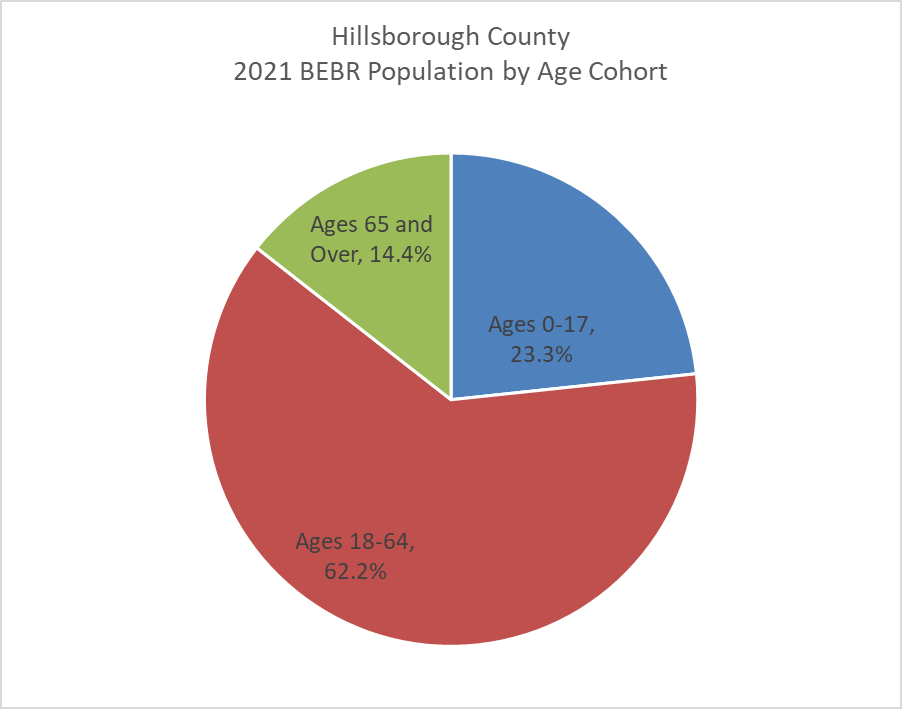
Figure 1d. 2021 Population Pyramid for Tampa Bay Region Counties
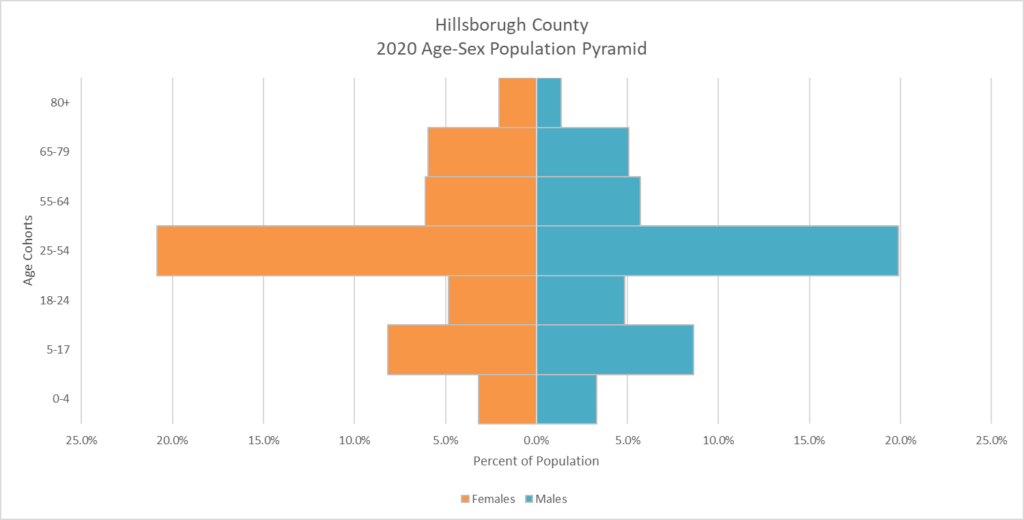
Figure 1e. Share of 2050 Population Projection by Age Cohort for Tampa Bay Region Counties
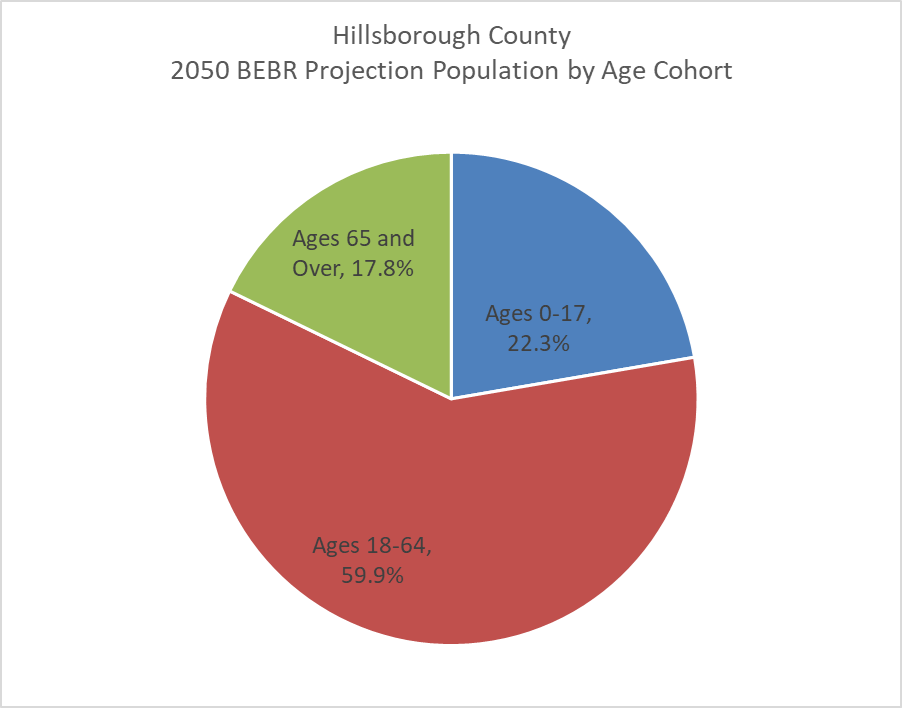
Figure 1f. 2050 Population Pyramid for Tampa Bay Region Counties
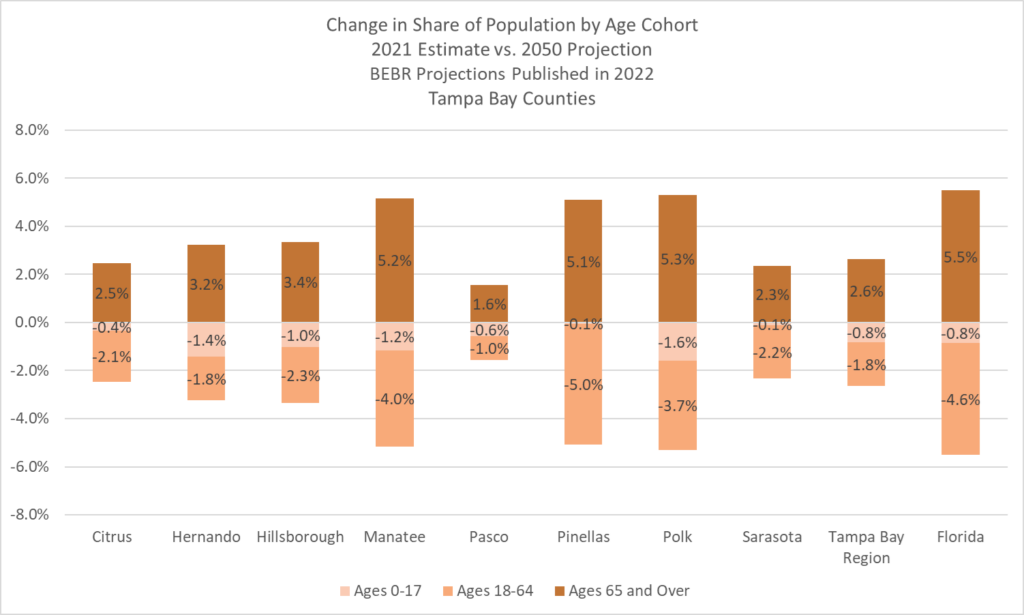
As seen in Figures 2a-2c, below, amongst the eight (8) Tampa Bay Region counties, Hillsborough County has the highest share of working age population and lowest share of retirees. By 2050, Hillsborough is projected to still have the highest of its population classified as “working age” (59.9%) and lowest share its population classified as “retirees” (17.8%. At least 1 out of 2 residents in Hernando, Pasco, Pinellas, and Polk are expected to be of working age through 2050. Alternatively, at least 1 out of 3 residents in Citrus, Hernando, Manatee, Pinellas, and Sarasota will be retirees through 2050. Figure 2d reveals that all eight counties will see a decline in the working age population and an increase in the retiree population. Particularly, Manatee, Pinellas, and Polk will see the largest decrease in working age population and largest increase in retiree population.
Figure 2a. Share of 2010 Population Estimate by Age Cohort for Tampa Bay Region Counties
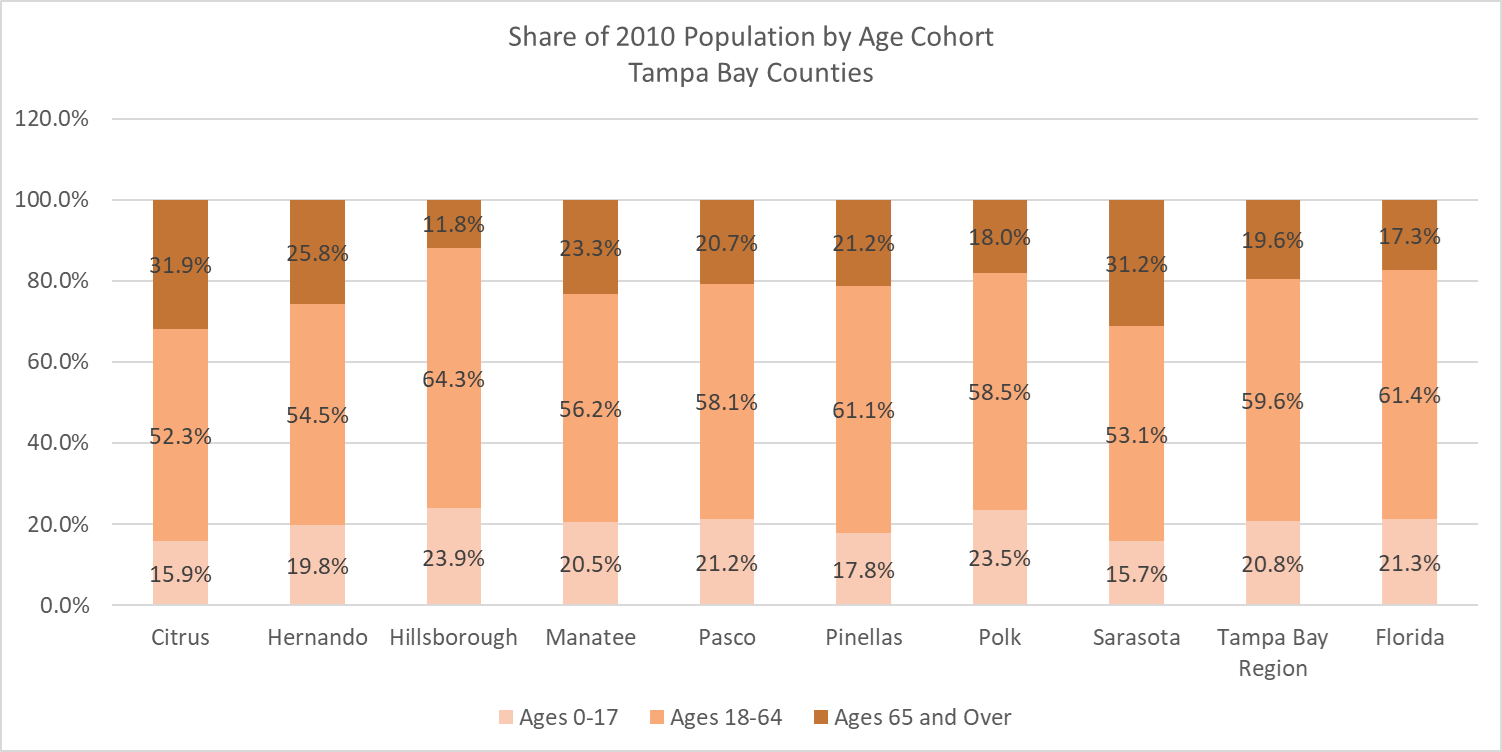
Figure 2b. Share of 2021 Population Estimate by Age Cohort for Tampa Bay Region Counties
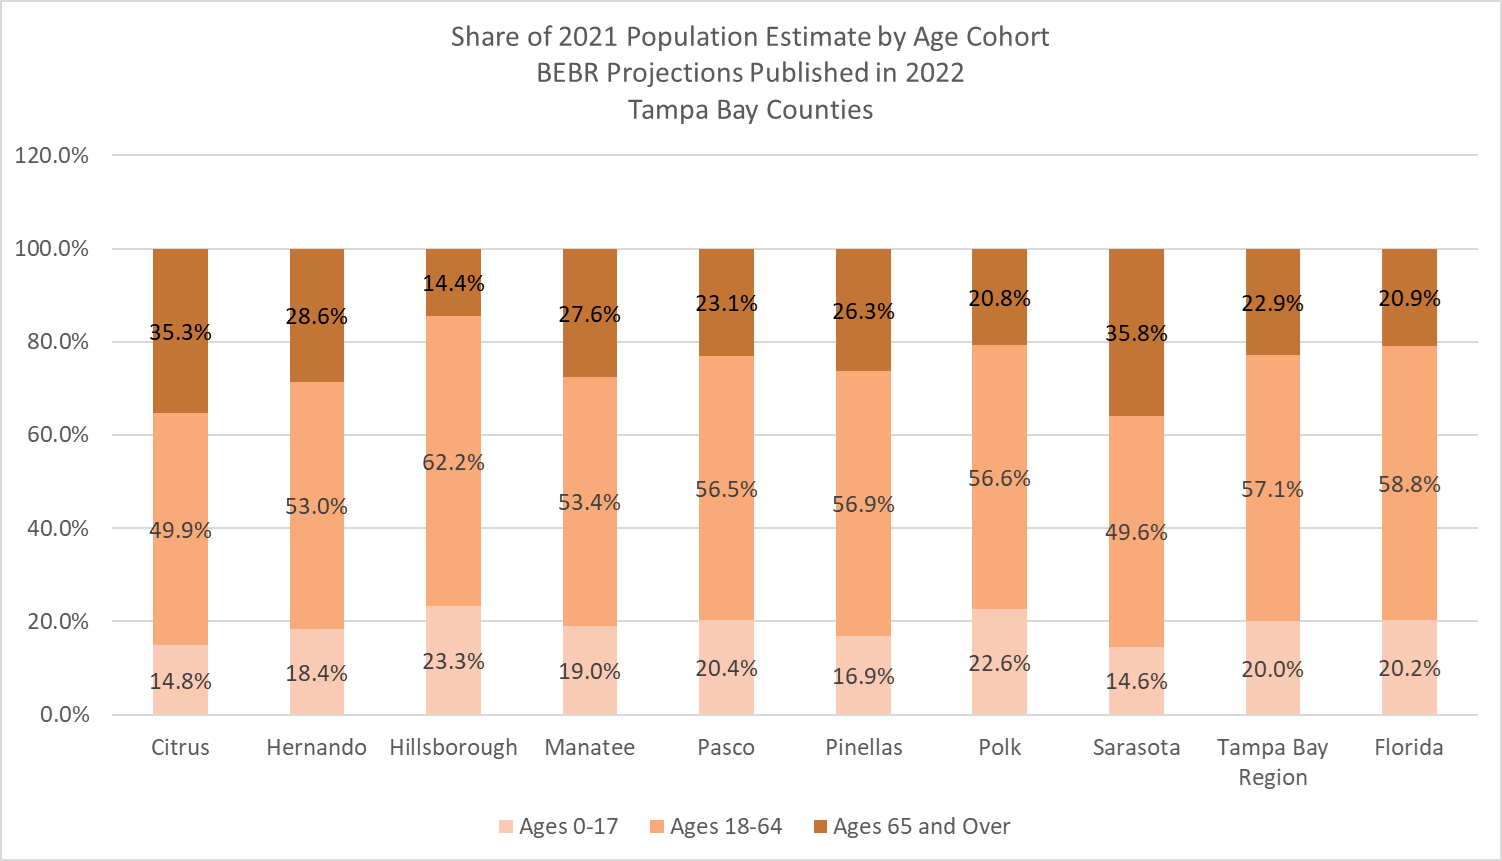
Figure 2c. Share of 2050 Population Projection by Age Cohort for Tampa Bay Region Counties
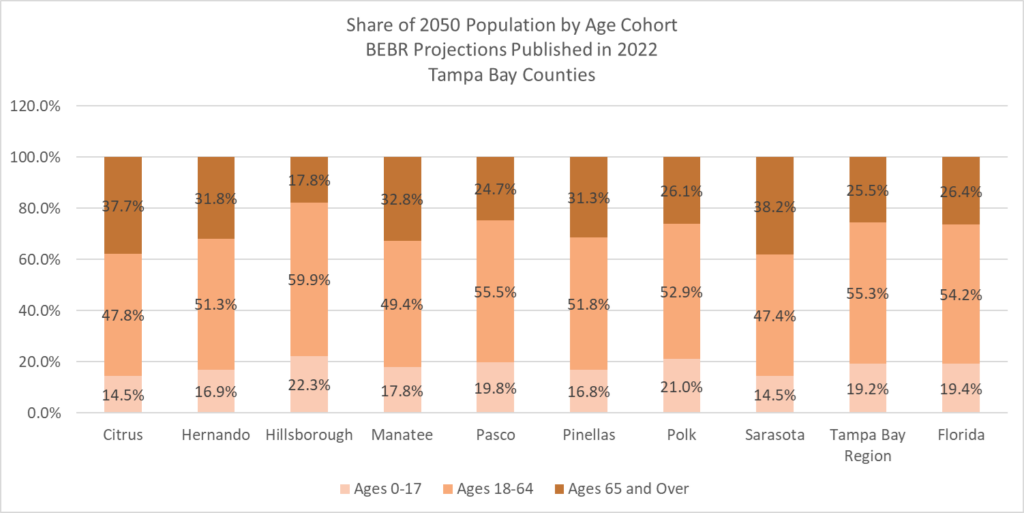
Figure 2d. Change in Share of Population by Age Cohort for Tampa Bay Region Counties
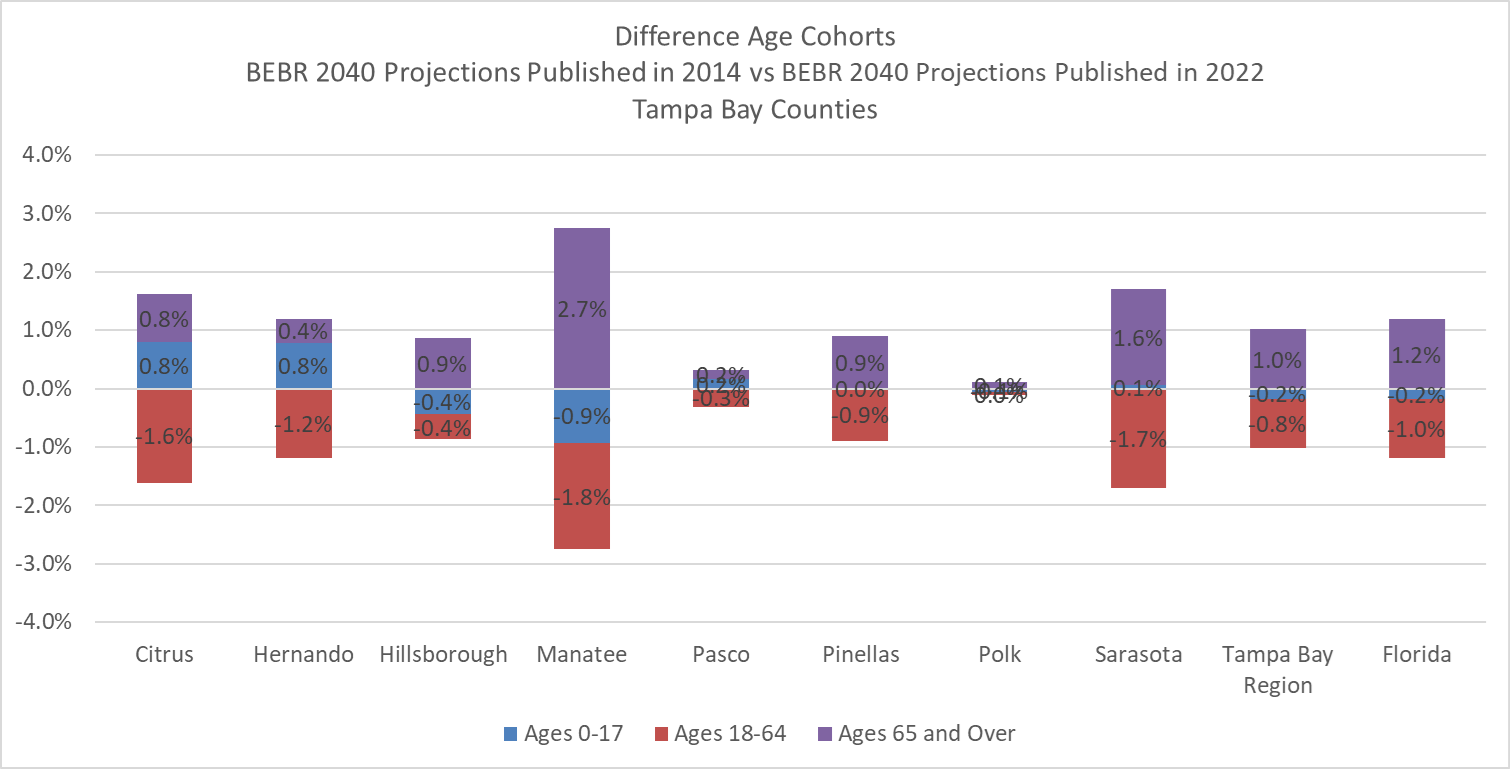
Lastly, as seen in Figures 3a to 3c, below, for 4 of 8 counties in the Tampa Bay Region, there appears to be consistency in the age cohort forecasts. When we compared BEBR 2040 projections by age cohort published in 2022 to the BEBR 2040 projection by age cohort published in 2014[ii], four of the 8 counties show little difference in the projected cohort shares. In the case of Hillsborough County, back in 2014, BEBR projected the working age population and retirees will be 60% and 16.7% of the total population, respectively. More recently, in 2022, BEBR projected the working age population and retirees will be 59.6% and 17.6% of the total population, respectively. Alternatively, Citrus, Manatee, and Pinellas County show the largest decreases in the working age population and largest increases in retiree population.
Figure 3a. Share of BEBR 2040 Population Projection Published in 2014 by Age Cohort for Tampa Bay Region Counties
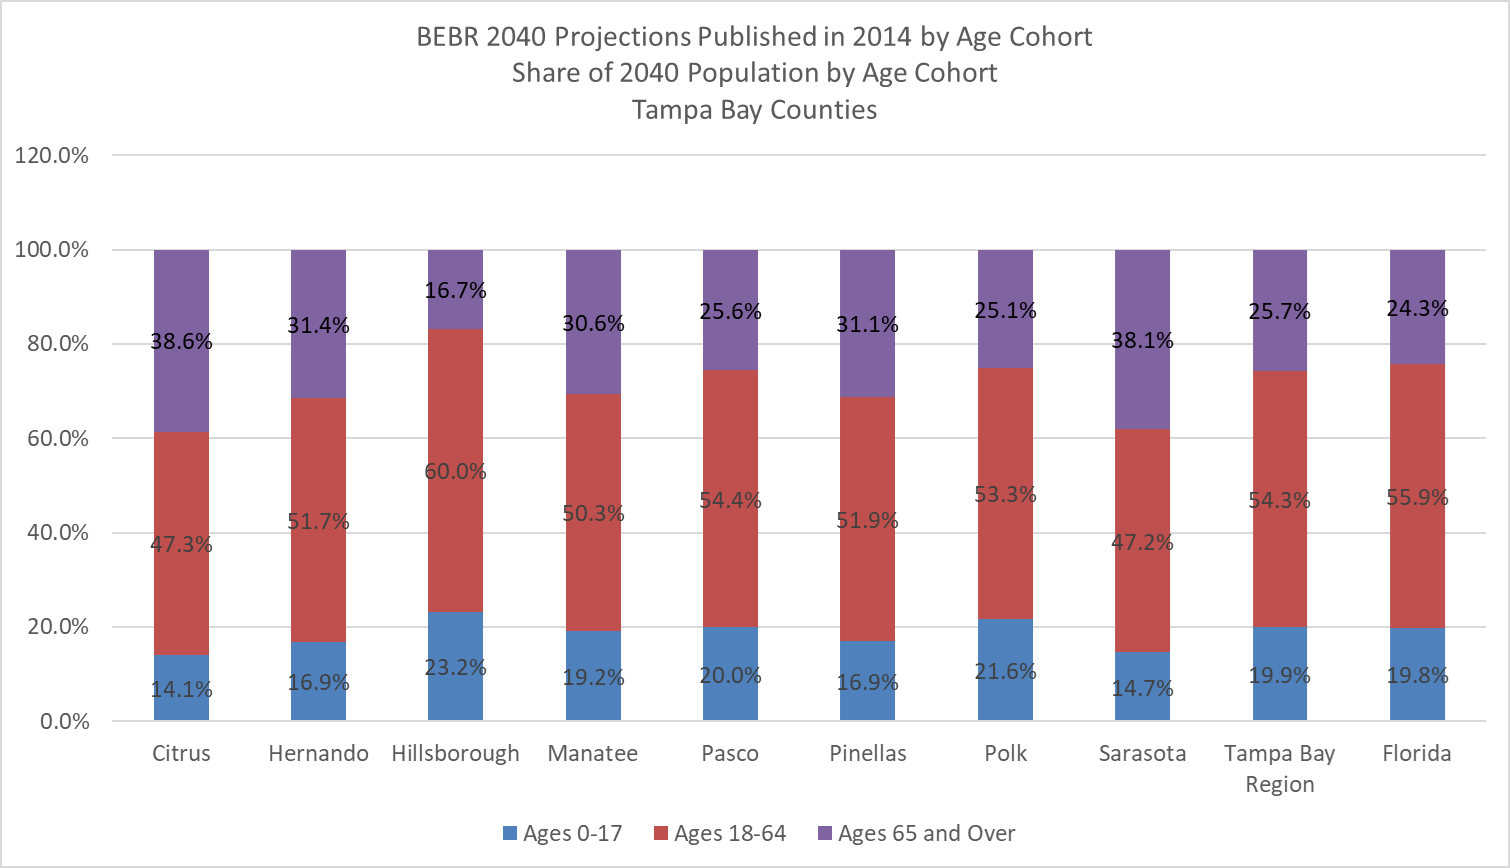
Figure 3b. Share of BEBR 2040 Population Projection Published in 2022 by Age Cohort for Tampa Bay Region Counties
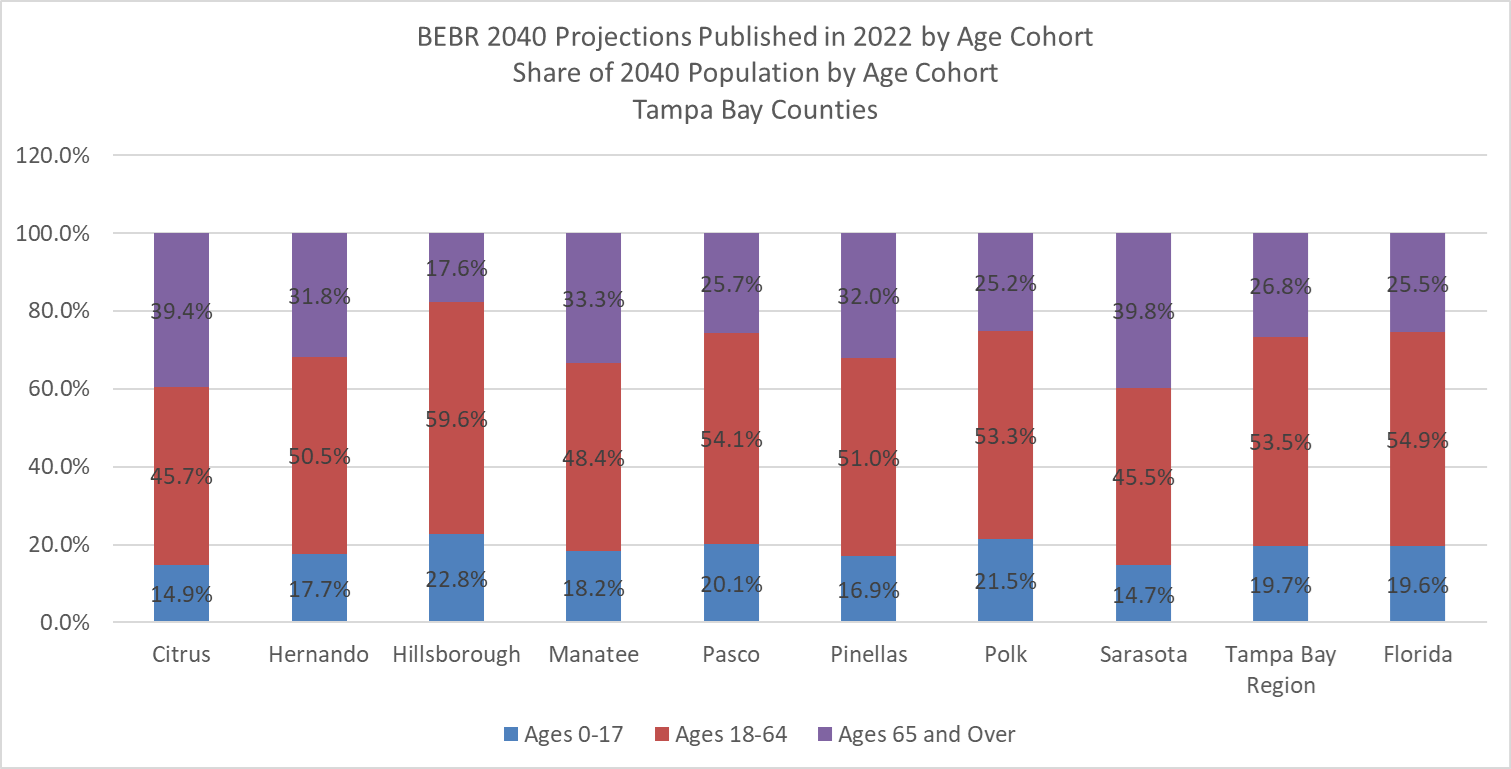
Figure 3c. Change in Share of 2040 Population by Age Cohort for Tampa Bay Region Counties
As we have seen, BEBR is not expecting the age distribution of Hillsborough County residents to change radically by 2050. For the eight (8) the counties in the Tampa Bay Region, working age population is trending down and retiree population is trending up. Still, Hillsborough County is expected to host the largest working age population and smallest retiree population in the Tampa Bay Region through 2050.
[i] Population Projections by Age, Sex, Race, and Hispanic Origin for Florida and Its Counties, 2025–2050, With Estimates for 2021. Bureau of Economic and Business Research. Florida Population Studies. Bulletin 193, October 2022.Link: https://www.bebr.ufl.edu/wp-content/uploads/2022/10/projections_2022_asrh.pdf
[ii] Population Projections by Age, Sex, Race, and Hispanic Origin for Florida and Its Counties, 2015–2040, With Estimates for 2013. Bureau of Economic and Business Research. Florida Population Studies. Bulletin 169, June 2014.Link: https://www.bebr.ufl.edu/sites/default/files/Research%20Reports/projections_2014_asrh.pdf