


Published
September 1, 2023
Contact
Yassert A. Gonzalez
Manager – Economics, Demographics & Research
813-582-7356 (o)
[email protected]
planhillsborough.org
Last updated
November 30, 2023
Every five years staff conducts an exercise collaborative which results in new long-range forecasts[1]. The forecasts and all supporting documentation are found here: 2050 Long Range Growth Forecasts. In the next several months, we are going to be publishing a series of articles on this subject. See previous articles here. This month, we are reviewing 2050 projections for Plant City.
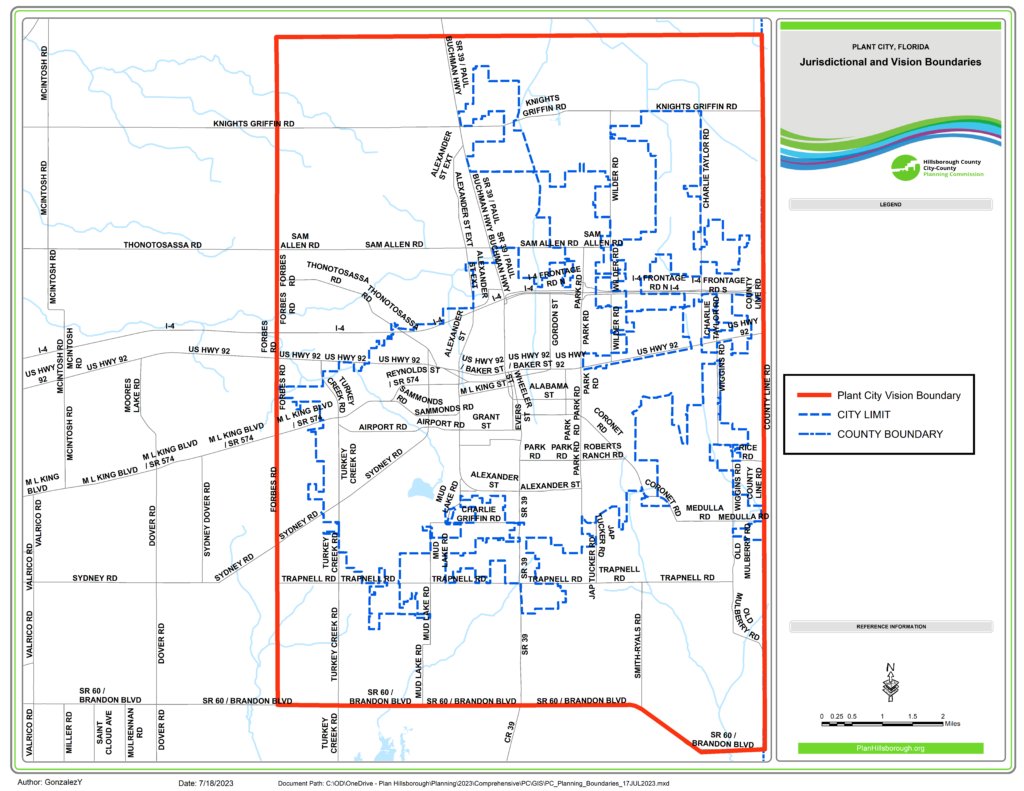
For Plant City, we are looking at two boundaries: City of Plant City and Plant City Vision Boundary (See Figure 1). Here are the descriptions for these boundaries:
- City of Plant City Boundary – This is the municipal boundary for Plant City.
- Plant City Vision Boundary – This is the area planning area for the Plant City Comprehensive Plan. As seen in Figure 1, this area is the largest boundary.
Figure 1. Three Planning Boundaries for City of Plant City
Given the significant amount of development expected in the Plant City area, the projections were made under the following assumptions:
- Growth in Plant City is expected to accelerate. Historical growth rates inside the Plant City Service Area are expected to double.
- For the Northeast Plant City Area, the projected values were calculated using densities from the Northeast Plant City Area Master Plan
- For developable and redevelopable parcels just outside the Plant City jurisdictional boundary but inside the Plant City Service Area, it is anticipated that Plant City will continue its program of annexations.
For more details, see technical documentation for 2050 Long Range Growth Forecasts.
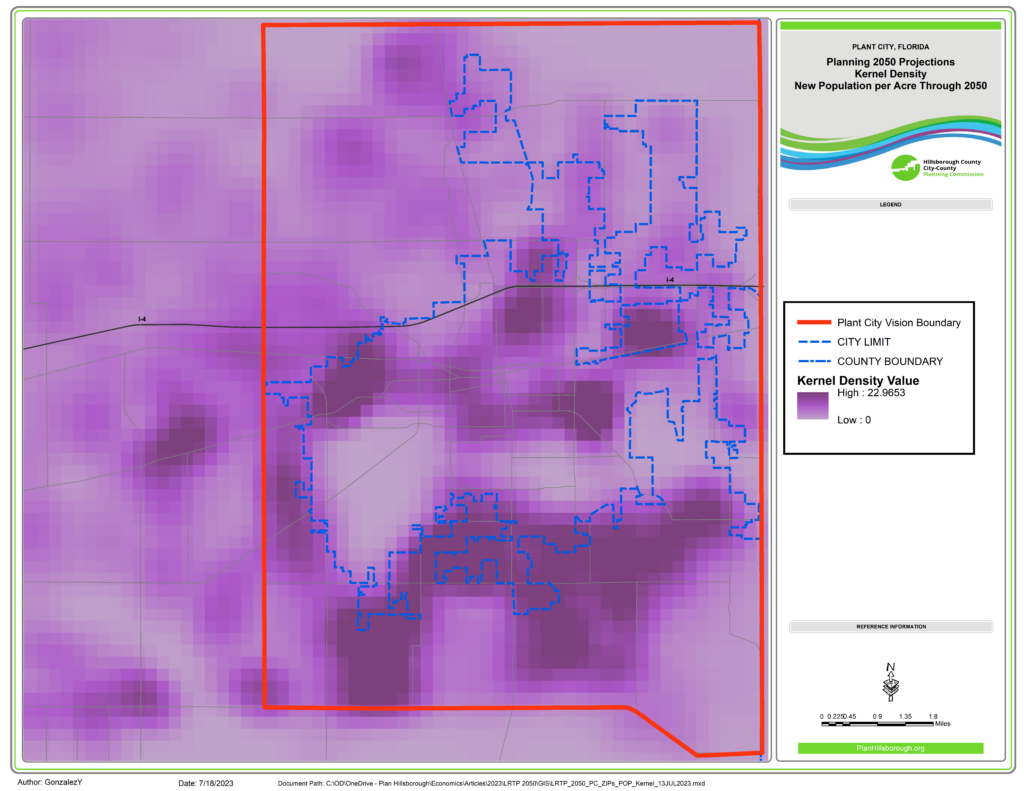
As stated in an earlier article, from 2010 to 2020 the Plant City’s jurisdictional population grew 15% to 39,846 residents. By 2050, as seen in Tables 1 and Figure 1, planners expect Plant City’s jurisdictional population to reach 76,677 people (36,831 new residents or 92% higher than 2020 population). Moreover, nearly 1 in 5 newcomers to Hillsborough County will be moving to the Plant City Vision Boundary area. Figure 2 shows areas (in darker purple) where most new residents are most likely to move.
Table 1. Population Projections by Plant City Planning Boundary
| Planning Boundary | Current (2020) | 2050 | Future (2050) | Percent Change | Share of New Countywide Population |
| Plant City | 39,846 | 76,677 | 36,831 | 92% | 7% |
| Plant City Vision Boundary | 62,380 | 154,113 | 91,733 | 147% | 17% |
Figure 1. Current and Future Population by Plant City Planning Boundary
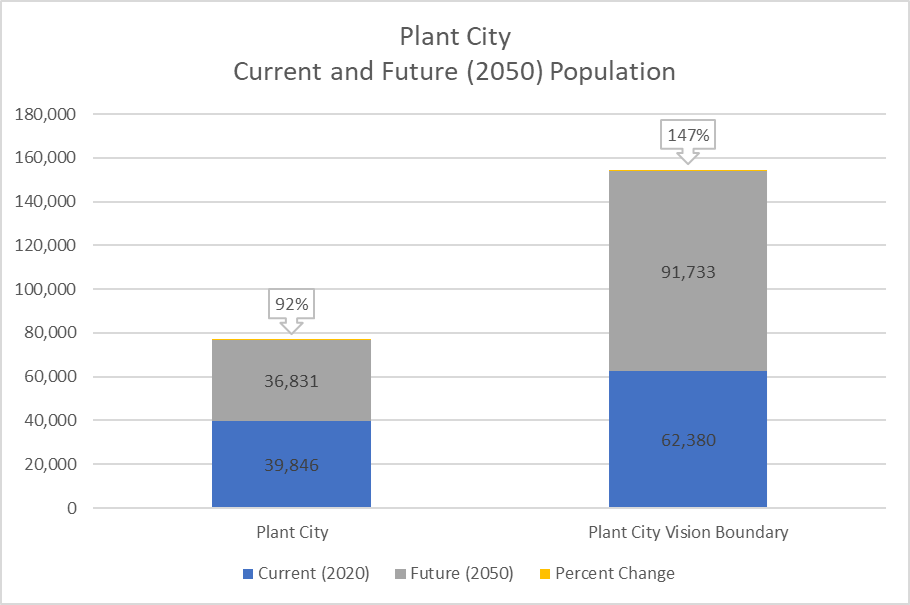
Figure 2. Kernel Density of New Population per Acre Through 2050 for Plant City Vision Boundary
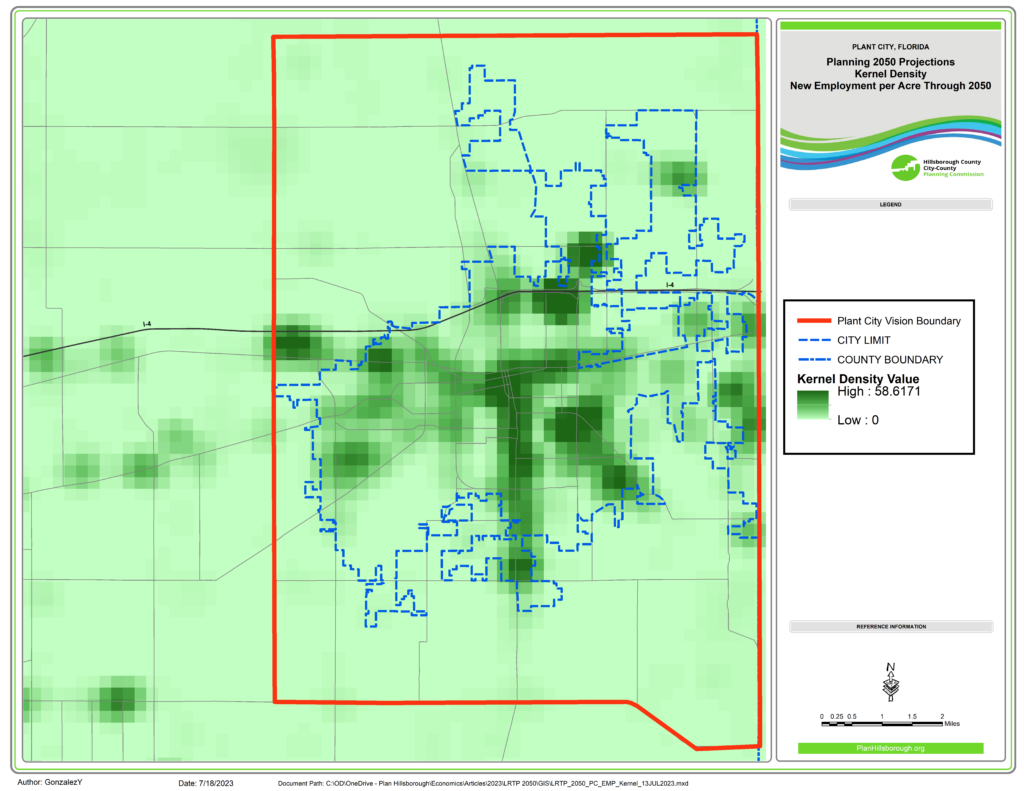
In terms of employment, from 2010 to 2020 the Plant City’s jurisdictional employment grew 30% to 33,939 jobs (See Demographic Profile). By 2050, as seen in Table 2 and Figure 3, Plant City’s jurisdictional employment is expected to double (35,626 new jobs or 105% higher than 2020 jobs). Nearly 1 in 10 new jobs in Hillsborough County will be located within the Plant City Vision Boundary. Figure 4 shows areas (in darker green) where most new jobs are most likely to be located.
Table 2. Employment Projections by Plant City Planning Boundary
| Planning Boundary | Current (2020) | 2050 | Future (2050) | Percent Change | Share of New Countywide Employment |
| Plant City | 33,939 | 69,565 | 35,626 | 105% | 8% |
| Plant City Vision Boundary | 37,969 | 77,463 | 39,495 | 104% | 9% |
Figure 3. Current and Future Employment by Plant City Planning Boundary
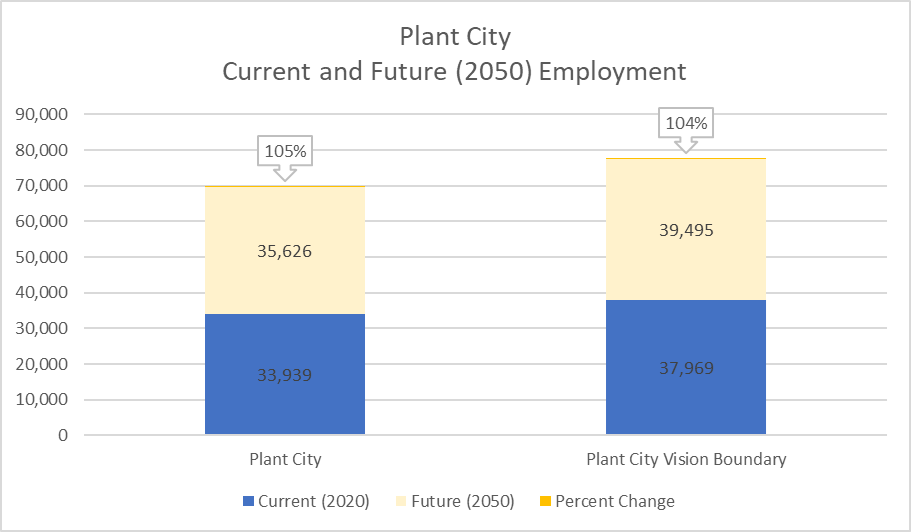
Figure 4. Kernel Density of New Employment per Acre Through 2050 for Plant City Vision Boundary
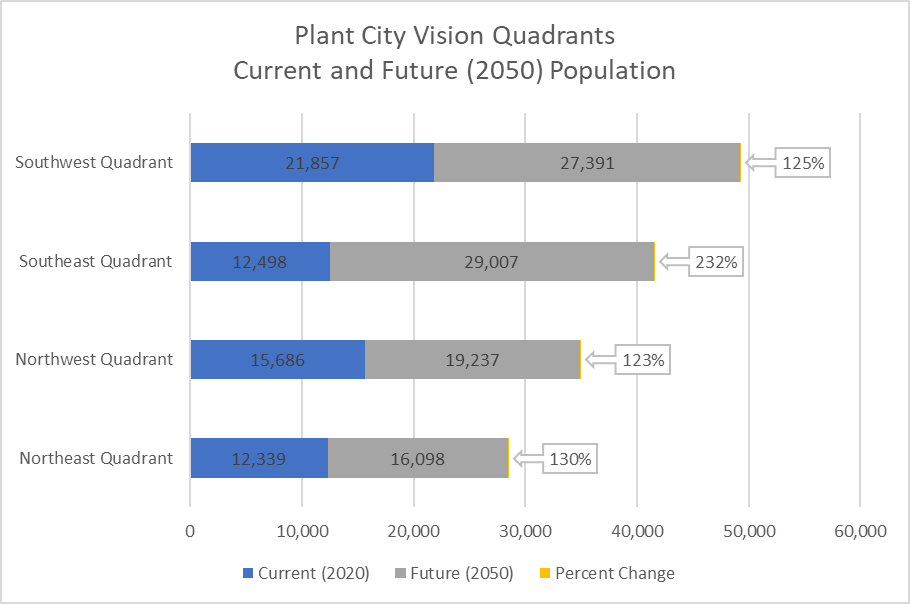
As seen in Figure 5, the Plant City Vision Boundary is divided into four quadrants. The northeast and southeast quadrants are expected to receive the most new residents and new jobs through 2050. These two quadrants are projected to receive nearly 1 out 2 new residents and 2 out of 3 new jobs.
Figure 5. Plant City Vision Boundary Quadrants
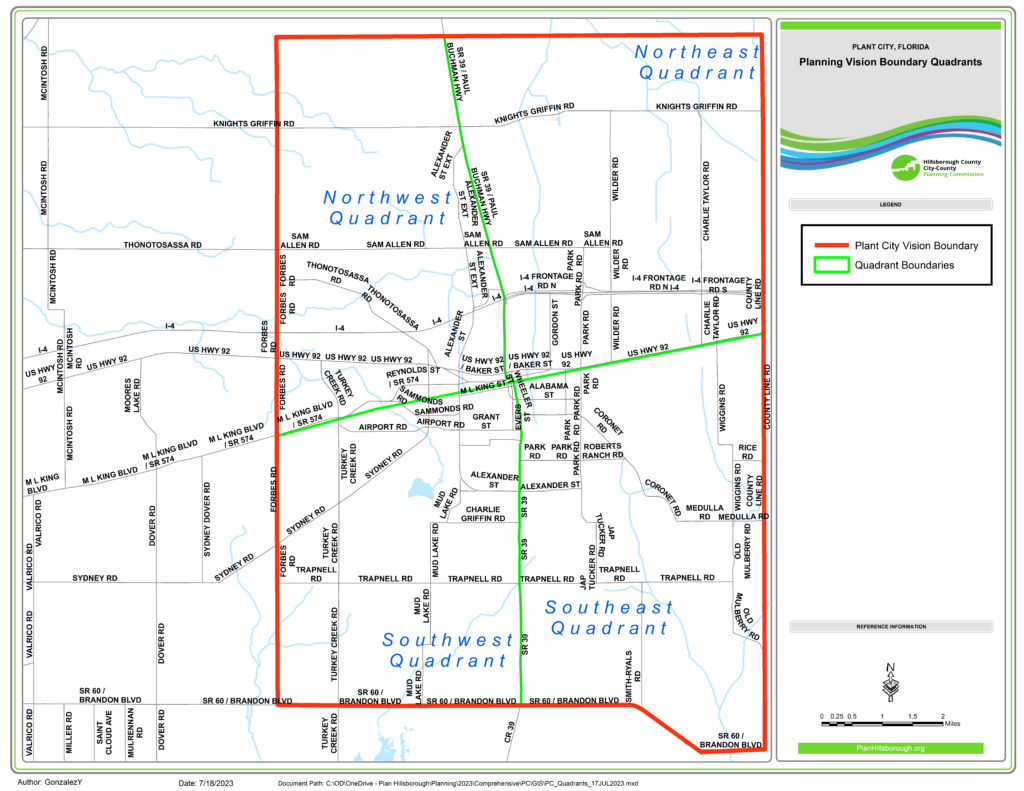
Table 3. Population Projections by Plant City Vision Boundary Quadrant
| Plant City Vision Boundary Quadrants | Current (2020) | 2050 | Future (2050) | Percent Change | Share of New Vision Boundary Population |
| Northeast Quadrant | 12,339 | 28,437 | 16,098 | 130% | 18% |
| Northwest Quadrant | 15,686 | 34,923 | 19,237 | 123% | 21% |
| Southeast Quadrant | 12,498 | 41,505 | 29,007 | 232% | 32% |
| Southwest Quadrant | 21,857 | 49,248 | 27,391 | 125% | 30% |
| Total | 62,380 | 154,113 | 91,733 | 147% | 100% |
Figure 6. Current and Future Population Projection by Plant City Vision Boundary Quadrant
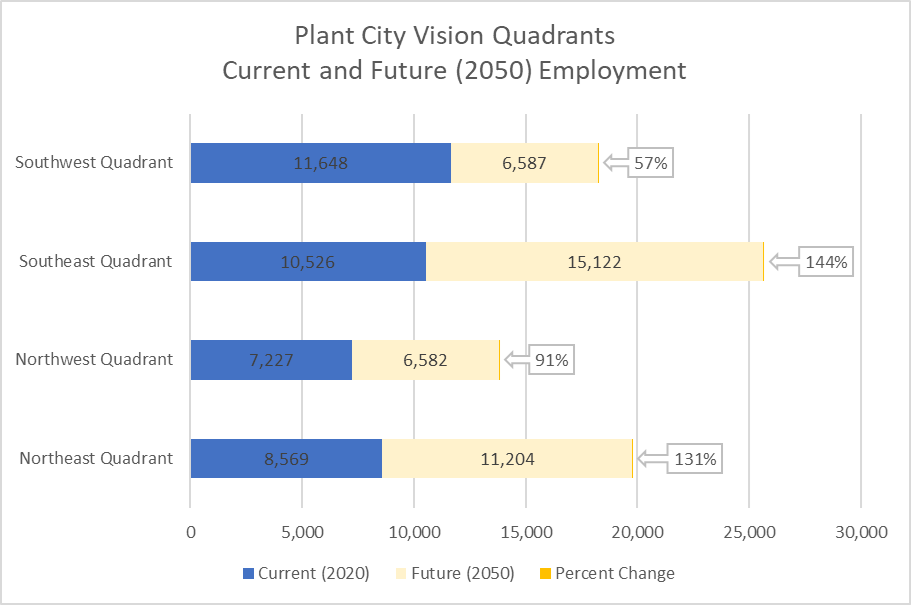
Table 4. Employment Projections by Plant City Vision Boundary Quadrant
| Plant City Vision Boundary Quadrants | Current (2020) | 2050 | Future (2050) | Percent Change | Share of New Vision Boundary Employment |
| Northeast Quadrant | 8,569 | 19,772 | 11,204 | 131% | 28% |
| Northwest Quadrant | 7,227 | 13,809 | 6,582 | 91% | 17% |
| Southeast Quadrant | 10,526 | 25,648 | 15,122 | 144% | 38% |
| Southwest Quadrant | 11,648 | 18,234 | 6,587 | 57% | 17% |
| Total | 37,969 | 77,463 | 39,495 | 104% | 100% |
Figure 7. Current and Future Employment Projection by Plant City Vision Boundary Quadrant
To conclude, Plant City is expected to lead the county population and job growth rates through 2050. There will be 36,831 new residents (92% increase from 2020) and 35,626 new jobs (105% increase from 2020). The Plant City Planning Boundary is expected to attract nearly 1 in 5 new residents and 1 in 9 new jobs to Hillsborough County. For more information: 2050 Long Range Growth Forecasts.
[1] The initial draft was based BEBR’s projections published in 2022. Link: https://www.bebr.ufl.edu/wp-content/uploads/2022/02/projections_2022.pdf